Home » June 30th, 2011
June 2011
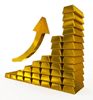
The correlation between the gold price from 1968 until 1979 and from early 2000 until today is an amazing 89.65%! More specifically, the correlation from 1975 until April 1979 and from January 2008 until today is an astonishing 97.83% suggesting that gold will reach an ultimate top of $5,000 per troy ounce before the bubble bursts. Words: 330
June 30th, 2011 | Posted in Gold/Silver,Investing | Read More »
Of the 133 analysts who have now gone public in maintaining that gold will eventually go to a parabolic peak price of 2,500/ozt.+ before the bubble bursts 90 – yes 90 – maintain that gold will reach at least 5,000 per ozt. Take a look here at who is projecting what, by when. Words: 954
June 29th, 2011 | Posted in Gold/Silver,Investing | Read More »
Today’s gold price of $1500+ is low…if I compare it to all other financial assets…[and if] I compare it to returns achieved since 1976 from the stock market and to the growth in US Federal liabilities. [Frankly, I can justify a price as high as $20,000 per troy ounce as early as 2020 and that is even without hyperinflation. Let me show you why.] Words: 1343
June 29th, 2011 | Posted in Gold/Silver,Investing | Read More »

Greece is going to default and even take the euro, and maybe the EU, with it. There will be 5 investment opportunities should that unfold as expected and one of them will be the U.S. dollar. [Let me explain.] Words: 1187
June 29th, 2011 | Posted in Debts/Deficits,Economy,U.S. Dollar | Read More »
Every single day the U.S. economy is getting weaker. Every single day we are going into more debt. Every single day we get closer to the collapse of the entire system but time is running out. The entire U.S. financial system has become a gigantic shell game (a confidence trick to perpetrate fraud) but when it ends the consequences can be painful and, sadly, that [pain is eventually going to be ours to experience. Let me explain.] Words: 1483
June 28th, 2011 | Posted in Debts/Deficits,Economy | Read More »
CPM Group’s recently released its 2011 Silver Yearbook…[which] presents some interesting facts that paint a decidedly bullish picture for the metal going forward. If you’re a silver investor, and/or are concerned about the recent selloff, you may find the following data very compelling. It provides an inside track on the market and will certainly make you a more knowledgeable investors.[Read on!] Words: 1280
June 28th, 2011 | Posted in Gold/Silver,Investing | Read More »
The budgetary and fiscal crisis right now has made many political issues far clearer in people’s minds. The debt dilemma is a challenge and an opportunity to set America on a freer and potentially more prosperous track, if the reality of the situation is looked at foursquare in the eye. Otherwise, dangerous, destabilizing, and damaging monetary and fiscal times may be ahead. [Here is how I see the situation and how I would propose solving the inherent problems.] Words: 3518
June 28th, 2011 | Posted in Debts/Deficits,Economy | Read More »
I have identified 248 stocks with histories of 10+ years of raising dividends…and ranked the yields and payout ratios of each…to create an average overall rank for each stock. Here are the top 10 on the list. Words: 325
June 28th, 2011 | Posted in Asset Allocation,Investing | Read More »
It is my contention that the price of gold rallies whenever the U.S. dollar’s real short-term interest rate is below 2%, falls whenever the real short rate is above 2%, and holds steady at the equilibrium rate of 2%. Furthermore, for every one percentage point real rates differ from 2%, gold moves by eight times that amount per year. So if the real rates are at 1%, gold will move up at an 8% annualized rate. If real rates are at 0%, then gold will move up at a 16% rate (that’s been about the story for the past decade). Conversely, if the real rate jumps to 3%, then gold will drop at an 8% rate. [Let me explain.] Words: 982
June 27th, 2011 | Posted in Gold/Silver,Investing | Read More »
According to conventional market wisdom, there are three safe haven currencies: the Swiss franc, Japanese yen, and US dollar. It is to these currencies that investors flock whenever there is a crisis, or merely an outbreak of uncertainty, and for much of the period following the collapse of Lehman Brothers, the three were closely correlated [but that is nolonger the case as the title of this article so indicates. Let me show you what has happened of late.] Words: 670
June 22nd, 2011 | Posted in Economy,U.S. Dollar | Read More »