The Economy Is Sliding Into a Stagflationary Spiral
Most economists see the latest Q1 GDP stumble as a blip, something we shouldn’t worry about because the economy is still on track for recovery…[but] another way to look at it is that the economy is being harmed by monetary inflation and we are seeing massive distortions in the economy as a result of this intentional Fed policy – economic growth is stalling and industrial production, manufacturing, non-manufacturing, durable goods production, retail sales and employment is flattening-to-declining… I think this is the correct way of looking at things and, [as such,] Q1 is not a temporary blip on the road to recovery… [but another mile down the road to]economic stagflation, price inflation, lower real estate prices, continuing high unemployment, a weaker dollar, higher taxes [and more – much more! Let me explain.] Words: 2997
So says Econophile (www.dailycapitalist.com) in an article*which Lorimer Wilson, editor of www.munKNEE.com , has further edited ([ ]), abridged (…) and reformatted below for the sake of clarity and brevity to ensure a fast and easy read. Please note that this paragraph must be included in any article re-posting to avoid copyright infringement. Econphile goes on to say:
One would think that, with all the money that the Fed is pumping into the economy through quantitative easing, GDP would rise. After all, GDP at its basic level is merely a measure of dollars spent in the economy and if you just throw more dollars into the mix, the result would be that GDP would rise (along with prices) just because of that. More spending, [however,] does not necessarily measure real growth in the economy; only an account of the physical production of goods can measure that.
——————————————
[Rather than have you read through all the charts and analysis to substantiate the extremely insightful “outcomes “or results of the trip down the road I have outlined at the beginning of this article what effect Econophile sees this journney having on our economy and way of life to entice you to read the supportive charts and commentary that follow. It will be well worth your time.]- We are in a new phase of monetary expansion that will lead to further destruction of real capital which will result in economic stagnation.
- Despite the stagnation of the economy, we will see price inflation as long as the Fed keeps pumping up the money supply.
- For the next two or three years, real estate prices will continue to be depressed as lenders shed bad residential and commercial mortgage loans and REO. Of course, this will have an uneven impact around the country, but areas with the most overexpansion (malinvestment) will have the greatest declines.
- Banks are repairing their balance sheets and raising capital to meet new capital standards. This will ultimately lead to new credit creation, but in light of the Fed’s goal of creating price inflation, it is likely that real production will remain flat but asset prices will eventually take off as people seek inflation hedges.
- Capital destruction and stagnation will keep unemployment high.
- It is unlikely that the Fed will raise interest rates or reduce monetary growth as long as we have high unemployment, especially in an election year.
- The dollar will remain devalued, depending on the relative values of the euro and the RMB. This will continue to favor exporters and harm U.S. consumers.
- It is unlikely that serious reform of federal spending programs will occur and tax hikes are likely, including a national sales or VAT tax.
- The debt rating of U.S. Treasurys will decline, increasing the nominal cost of financing the debt.
- It is likely that we will see further monetization of Treasurys as it becomes more difficult to sell them on the world markets.
- The cost of financing the deficit will actually go down as rising price inflation will allow the government to pay debt with depreciated dollars.
- The eurozone will continue to have serious structural problems, starting with Greece and ending with Spain. It appears that it will be difficult to carry out necessary reforms. It will keep the euro under pressure.
- When inflation gets out of control, Bernanke will resign and a new Volcker will be appointed to increase Fed interest rates, increase reserve requirements and reduce its balance sheet, driving Treasurys and other interest rates way up. Because there are so many “what ifs” here, I am not forecasting a particular time or rate. For example, a Republican presidency and Congress could change the scenario and institute needed drastic reforms, but assuming they win, I still don’t see meaningful reforms.
——————————————
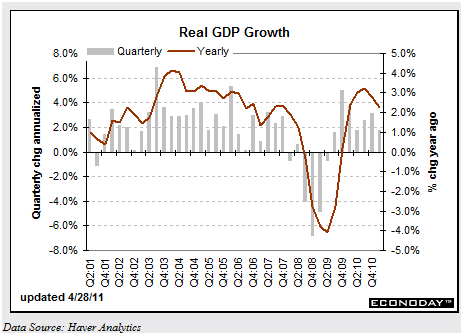
The conventional wisdom is that GDP is a measure of an economy’s health and if everyone believes that then policies, public and private, are based on it and it’s worth following. [Unfortunately, as exemplified by the fact] that GDP fell to 1.8% in Q1 [as seen in the graph below], down from 3.1% in Q4 2010, the question persists: why is the economy not performing up to the expectations of policy makers?
Money supply, as measured by the correct index, True (Austrian) Money Supply (TMS), has been expanding. This has been a result of QE and to a lesser extent, some expansion of bank credit. The following chart measures not only TMS but also M2:
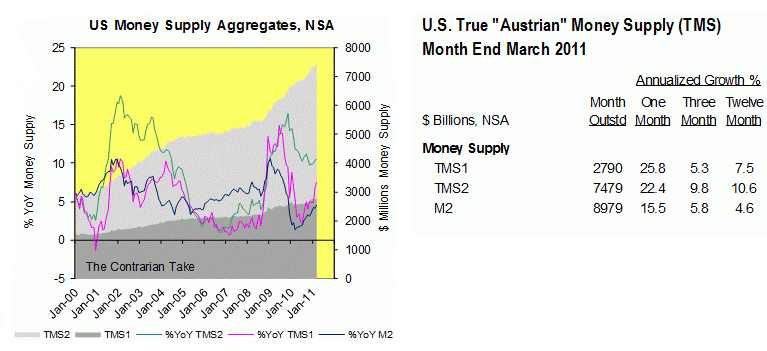
Courtesy Michael Pollaro, The Contrarian Take
What are these distortions and do we see them in the economy today?
1. Price Inflation
a) Producer Price Index
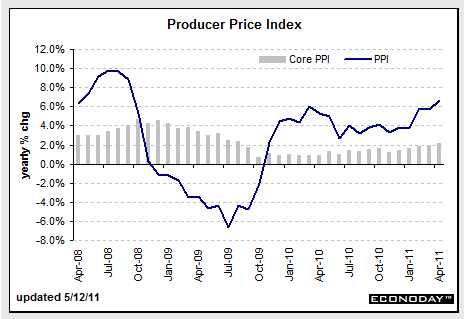
The headline consequence of monetary inflation is price inflation… [with] the Producer Price Index [below] showing that it went up again and is now at a 6.6% annual rate:
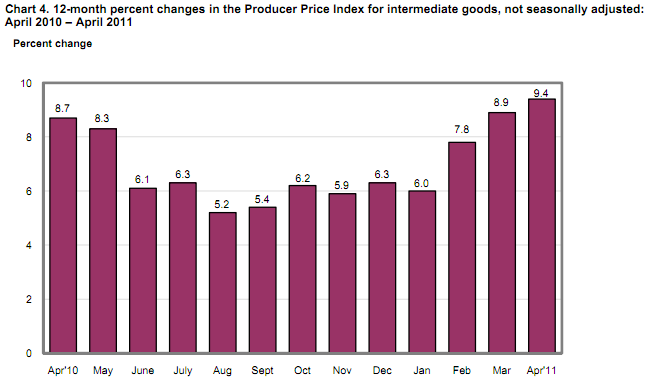
There is more to it than that, [however]. If you break it down and look at the non-seasonally adjusted measure of the production of intermediate goods and crude materials (e.g., steel billets, industrial chemicals), then you get a different picture [as seen in the bar chart below]:
i) Producer Price Index for Intermediate Goods
ii) Producer Price Index for Crude Materials
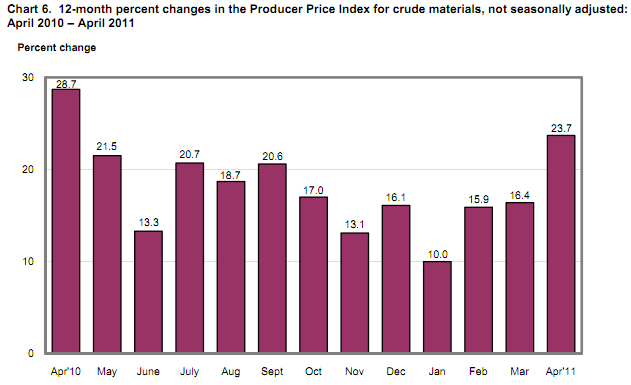
You could argue that this isn’t a fair measure because they are not seasonally adjusted, but they are actual numbers and the seasonality adjustments may involve a bit of magic that is sometime questionable.
b) Consumer Price Index
Price inflation at the consumer level, the one that consumers complain about, is rising [as the chart below so clearly identifies]:
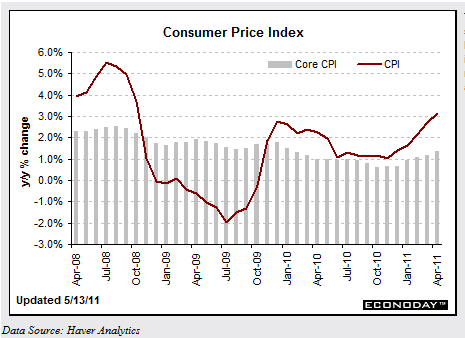
The CPI-U rose 0.4% (Core 0.2%) for the month of April and 3.2% (Core 1.3%) for the last 12 months. According to the BLS report, prices were driven by energy (2.2%), gasoline (3.3%, but 33.1% for last 12 months) and food (0.4%) costs. Thus by every measure price inflation is increasing.
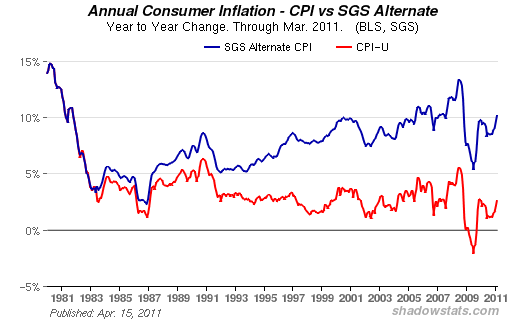
If you don’t trust the government’s data you can look at [the following two alterative modes of measurement]:
i) Shadowstats.com’s measure of consumer inflation:
ii) MIT’s Billion Price Project measure of consumer inflation:
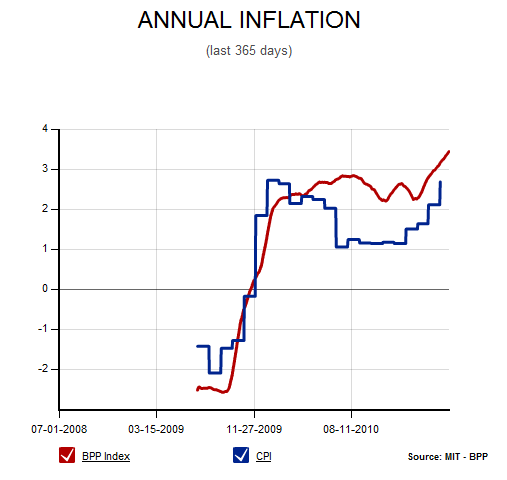
As you can see reasonable people differ on the level of price inflation, but none of them show it going down.
2. Export Growth
U.S. growth is being driven by exports ( contributing about 1.4 percentage points to the nation’s 3.0% annualized growth rate) and the chief beneficiaries of that are large multinational companies. The problem is that this trend of manufacturing growth is not spilling over into the rest of the economy, especially to the small companies (less than 250 employees), which employ one-half of Americans. The reason for this is that monetary inflation (fiat money) is a two-edged sword that helps exporters, destroys capital and penalizes consumers.
Sign up for our FREE weekly “Top 100 Stock Index, Asset Ratio & Economic Indicators in Review” report
There is no question that the reason exporters are successful is because the declining dollar is turning the so-called level international playing field into a ski slope for American exporters; they have a substantial monetary advantage in world markets. In the last 12 months, the dollar has declined 9.1%. Low U.S. interest rates (less attractive to foreign investors), QE and chronic deficit spending (prompting S&P’s threatened downgrade of U.S. sovereign debt) have devalued the dollar. While Dr. Bernanke can say with a straight face that the U.S. has a “strong dollar” policy, the world knows that is a lie and their true policy is to devalue the dollar to favor U.S. exporters.
The Fed and the administration see exports in terms of an engine of job creation, although that doesn’t appear to be working very well for them. What they miss is the greater cost to American consumers of imported goods. While it is true that oil prices are cartelized, the impact of a cheap dollar makes gasoline more expensive for consumers. That has a negative impact on retail spending.
a) Industrial Production
A close look at the “other” (non-export) economy belies the exports-as-leading-economic-growth trend. The data associated with manufacturing is either flattening or declining in the face of monetary expansion. This is a troubling thing considering how well exporters are doing.
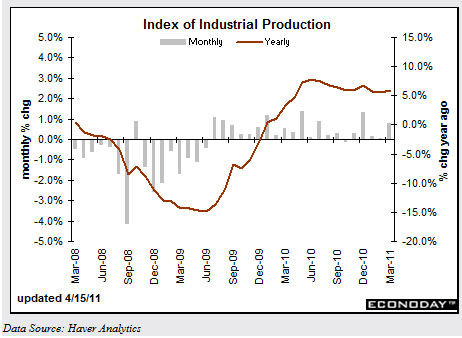
i) Index of Industrial Production
The latest data [as illustrated below] shows industrial production flattening-to-declining:
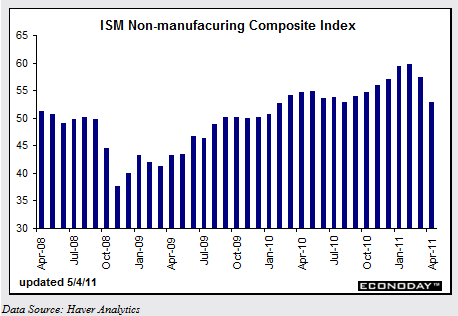
ii) ISM Non-manufacturing Index
The ISM Non-manufacturing Index [as seen below] has been declining for the past two months:
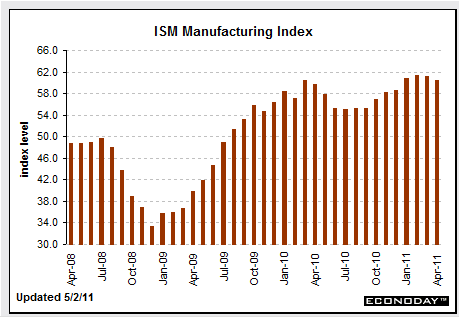
iii) The ISM Manufacturing Index
The ISM Manufacturing Index [below] is showing a flattening-to-declining trend:
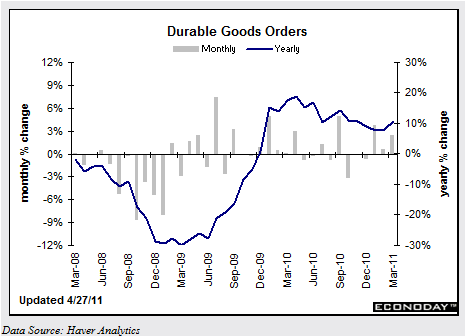
iv) Durable Goods Orders
Durable goods orders are on a declining trend as well [as seen in the chart below]:
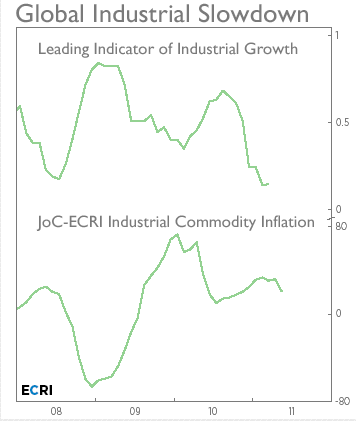
v) The ECRI Index of Industrial Growth
The ECRI index for industrial growth has turned negative. They apparently have a flawless (so far) record of forecasting economic cycles. Below is their chart:
3. Retail Sales
a) Retail sales have been flattening as well [according to the following chart]:
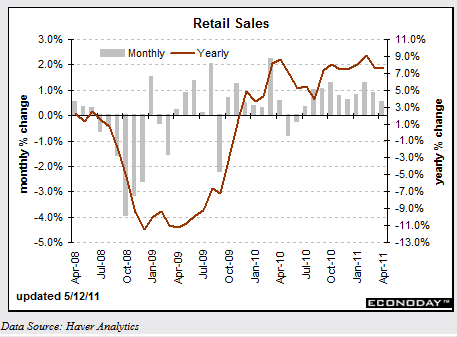
Retail sales’ recent “gains” are mostly related to increased spending on gasoline, not retail shopping. Retail sales, excluding autos and gasoline, in April only increased by 0.2%. Gallup’s recent surveys also supports this trend. In fact, they show that upper-income consumer spending has flattened out as well. It does not help that real wages declined 0.3% in April.
Who in the world is currently reading this article along with you? Click here to find out.
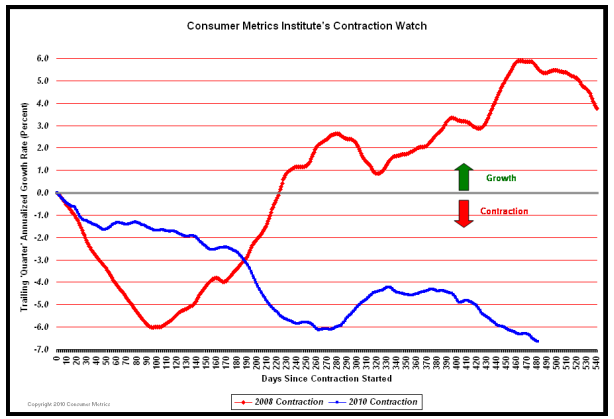
b) Consumer Metrics Institute Contraction Watch
Consumer Metrics Institute is also reporting that retail sales have fallen off dramatically( -6.39% year-over-year as of May 3, 2011) [as illustrated in the graph below]:
4. Employment
While there is definite improvement in employment, it is still weak and unemployment remains high:
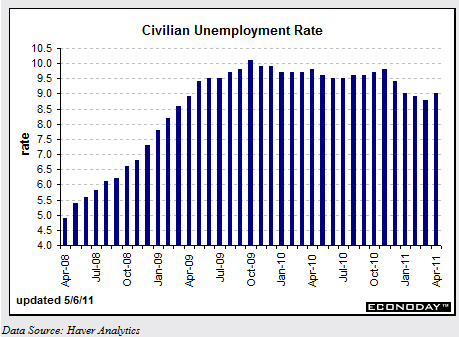
While job creation increased in April (private employment up 268,000), the overall unemployment rate went up to 9% from 8.8% [and to a surprising 9.1% as of the end of May!]. The Wall Street Journal had an interesting graphic describing the recent report:
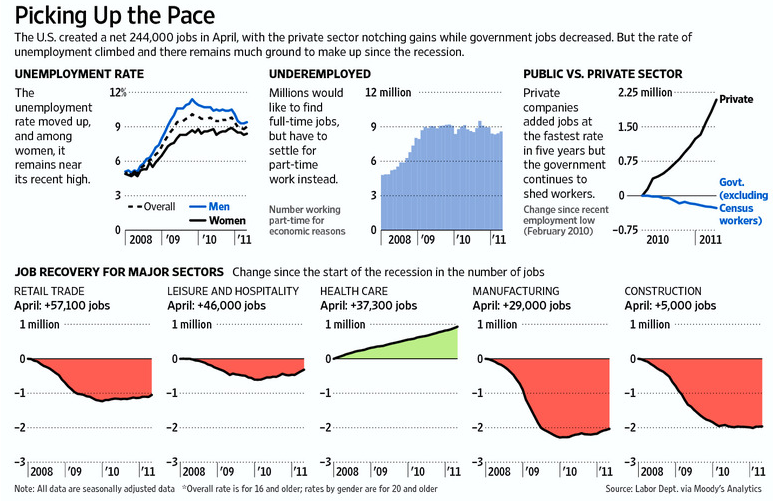
We added about 1.2 million jobs in 2010, but there are 13.7 million people still looking for work. Since April of last year, the labor participation rate actually declined from 65.1% to 64.2%.
[In addition,] a record 18.3% of the nation’s total personal income was a payment from the government for Social Security, Medicare, food stamps, unemployment benefits and other programs in 2010. Wages accounted for the lowest share of income — only 51.0% — since the government began keeping track in 1929. From 1980 to 2000, the percentage of Americans receiving government benefits was 12.5%. A jump to 18.3% is not a good sign as Boomers head into retirement and exercise their claims on Social Security and Medicare.The Bifurcated Economy
The conclusion of this profusion of charts and data is that while the export sector is thriving because of a de-valued dollar and while Wall Street and the financial sector have been the prime beneficiaries of QE, the rest of the economy is stalling. Considering all of the effort by the Fed from QE and the government’s attempts at fiscal stimulus, the economy is still sluggish and if it’s growing at all, it is because of the money steroids.
The reason the economy is not growing is that the Fed-government policies themselves are:
- destroying real capital/savings and
- are tying up capital in unliquidated malinvestments.
1. Real Capital Destruction
Monetary inflation cannot create wealth. Only production can create wealth… Our policy makers confuse the dollars they print with wealth. Things are wealth and money just is a means of exchanging some goods or labor for other goods or labor. This is Austrian Theory 101. If you print fiat money, it doesn’t create goods or labor, it just allows those who get their hands on it first to bid away goods and labor (wealth) from other producers (and, all things being equal, cause prices to rise). Since the new money was not based on production, someone is getting something for nothing. Because the signals that cheap money sends to borrowers is not based on market realities, but rather time value distorted realities, cheap money leads to the production of goods people don’t want – such as homes. As we found in our current cycle, capital flowed into housing and some $6 trillion was destroyed (malinvested) in the boom. The bust is merely the process of liquidating malinvestment.
It is difficult to determine how much capital is being consumed by monetary inflation. Instead of trying to figure that out, I look to its effects as evidence that it is occurring. As would be expected, the destruction and resulting shortage of real savings/capital has caused a decline in industrial production, high unemployment, sluggish or declining retail sales, a lack of credit and higher prices.
A good question is that if real savings/capital is being destroyed, why would exporters be successful? The idea being that despite their cheap dollar advantage, if they can’t muster the capital, shouldn’t they be stagnating? The obvious answer is that they do have sufficient capital to expand. This country has a huge reserve of real savings and not all of [it] was wiped out in the crash. Many of these companies do not need to rely on banks and can fund expansion from retained earnings or they can tap into the reservoir of capital through banks and the commercial paper markets.
2. Malinvestment and Liquidity
The prior expansion of money and credit by the Fed (2001 to 2006) created the biggest boom-bust cycle in world history – residential and commercial real estate.
There were two sources of credit that flowed into real estate.
1. From residential and (mostly) commercial real estate loans made by regional and local banks:
These loans were not packaged and sold off by these banks but were held on their books as bad loans as long as they could to avoid recognizing losses which would require them to either raise more capital or fail. The banking regulators have largely facilitated this approach by suspending mark-to-market rules, requiring them to take TARP money, plus other accounting rules.. It is these banks that are most affected by the real estate crash.
2. From large banks, pension funds, insurance companies and investment funds:
Their loans and investments were mainly funneled into mortgage-backed securities, were divided into tranches and sold worldwide. It’s not that they don’t have serious problems as a result of the fallout from the crash, including claims related to mortgage backed securities, but they are lending again and their customers, large corporations, are borrowing [and, as such, are not experiencing] a credit crunch.
3. Commercial Credit
These lenders, however, cannot hold back the flood [as] both commercial and residential real estate continues to decline in value. There was so much overproduction (malinvestment) that four years after the crash the problem still festers. The result was that these banks tightened up lending standards, were wary of committing to new loans and kept bad projects on life support hoping that things would turn around [- and there lies] the credit crunch. They are the lenders that one-half of American businesses rely on for credit but now there is a growing trend to liquidate these investments [with the] chasm that once separated banks’ marks on non-performing loans and realized sale prices shrinking… This is a positive trend, but it will continue to depress real estate prices for some years to come. [However,] as banks clear off their balance sheets, credit will start to loosen up. We are just starting to see some of that now.
Banks, for competitive reasons, have lowered lending standards for commercial and industrial business loans and bank credit is starting to expand. Loan demand, however, is coming mainly from larger- to intermediate-sized companies and M&A activity which means that credit demand from, and lending to, small businesses is still low and that QE money has been largely for the benefit of Wall Street and the large multinationals.
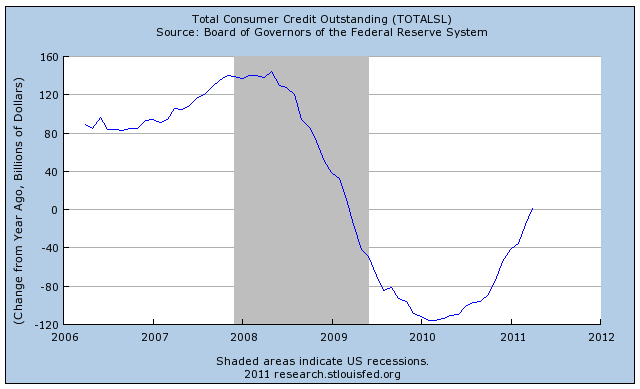
4. Consumer Credit
Consumer credit has been modestly expanding [as the chart below depicts]:
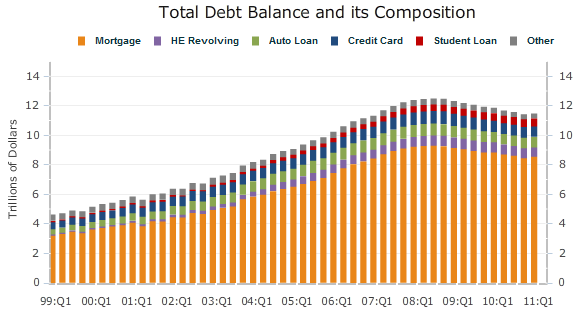
[As the graph below shows] auto loans and government-backed student loans [show the greatest increases]:
Outcomes
What does this all mean in terms of the future of the economy? [See all 13 near the top of this article.]
Conclusion
The size of the [last] boom phase of the cycle [was] something unprecedented in world history and the level of malinvestment was historic in scope. This is what the policy makers underestimated.
As we have discovered, we are stuck in between bust and recovery as banks struggle to liquidate malinvestments and repair their balance sheets, while at the same time the Fed is trying to inflate the way to recovery. We are experiencing the effects of these policies: stagflation. Which means the Q1 stumble was not just a blip.
*http://dailycapitalist.com/?s=stagflation&submit.x=0&submit.y=0
Related Articles:
- U.S. Debt Default Risk is Up Dramatically YTD https://munknee.com/2011/05/sovereign-debt-default-risk-has-risen-dramatically-in-u-s/
- These Signs Suggest Global Economy at a ‘Tipping Point’! https://munknee.com/2011/06/these-signs-suggest-global-economy-at-a-tipping-point/
- Are You Properly Positioned for the Global Slowdown Ahead? https://munknee.com/2011/06/are-you-properly-positioned-for-the-global-slowdown-ahead/
- Inflation to Surpass 4% in 1 Year; 6% Within 3 Years – Here’s Why https://munknee.com/2011/06/inflation-to-surpass-4-in-1-year-6-within-3-years-heres-why/
- The U.S. is Headed Towards Self-inflicted Disaster: Here’s Why https://munknee.com/2011/04/the-u-s-is-headed-towards-self-inflicted-disaster-heres-why/
- America’s Political Process Guarantees Another Financial Crisis! https://munknee.com/2011/03/america%e2%80%99s-political-process-virtually-guarantees-financial-crisis-2-0/
- Be Forewarned: Worldwide Systemic Financial Risk is Rising Rapidly – Again https://munknee.com/2011/05/be-forewarned-worldwide-systemic-financial-risk-is-rising-rapidly-again/
- Stephen Roach: Chances of World Sliding Back into Recession a Distinct Possibility https://munknee.com/2011/05/stephen-roach-chances-of-world-sliding-back-into-recession-a-distinct-possibility/
- Martin Armstrong: The Next Wave Begins June 13th, 2011 https://munknee.com/2011/05/martin-armstrong-the-next-wave-begins-june-13th-2011/
- Global Systemic Crisis Coming THIS Summer! https://munknee.com/2011/06/global-systemic-crisis-coming-this-summer/
Editor’s Note:
- The above article consists of reformatted edited excerpts from the original for the sake of brevity, clarity and to ensure a fast and easy read. The author’s views and conclusions are unaltered.
- Permission to reprint in whole or in part is gladly granted, provided full credit is given as per paragraph 2 above.
- Sign up to receive every article posted via Twitter, Facebook, RSS Feed or our FREE Weekly Newsletter.
Economy