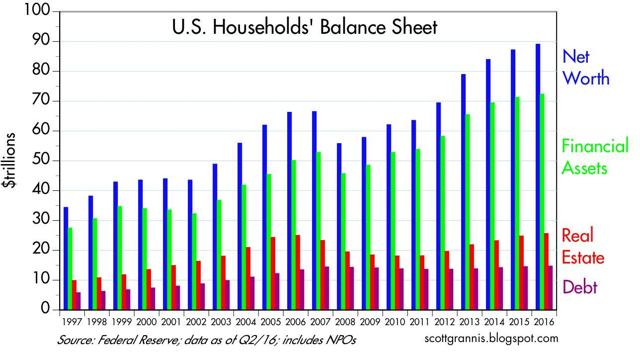
We are living in the weakest recovery ever, and things could and should be a lot better, but it is still the case that today we are better off than ever before [according to] the Fed Q2/16 estimate of the balance sheets of U.S. households [which shows that,] collectively, our net worth reached a new high in nominal, real, and per capita terms. [The bottom line is that, in fact,] life in the U.S. continues to get better and better.
The comments above and below are excerpts from an article by Scott Grannis (ScottGrannis.Blogspot.ca) which may have been enhanced – edited ([ ]) and abridged (…) – by munKNEE.com (Your Key to Making Money!)
to provide you with a faster & easier read.
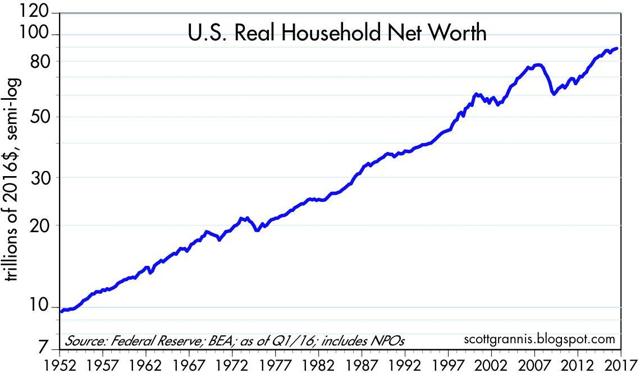
In real terms, household net worth has grown at about a 3.6% annualized rate for the past 65 years.
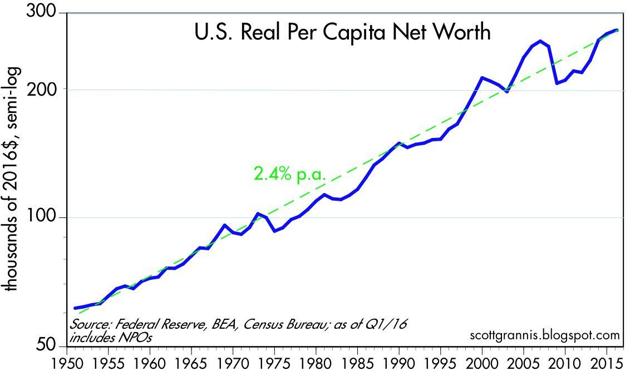
On a real per capita basis (i.e., after adjusting for inflation and population growth), the net worth of the average person living in the U.S. has reached a new all-time high of $277K, up from $62K in 1950. This measure of wealth has been rising, on average, about 2.4% per year since records were first kept beginning in 1951. Life in the U.S. has been getting better and better for generations.
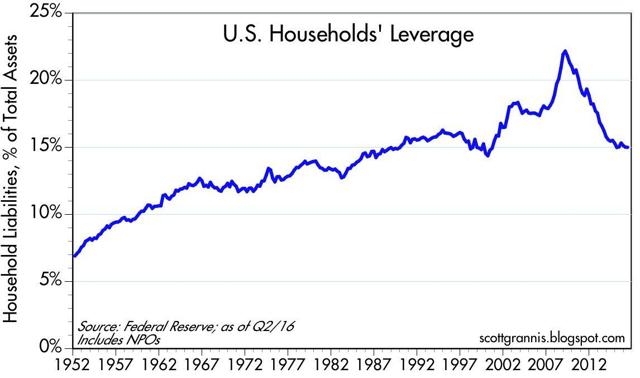
Households have been prudently and impressively strengthening their balance sheets over the past seven years. Unfortunately, our Federal government has more than doubled its debt burden over that same period, as I noted in a post earlier this week.
Follow the munKNEE – Your Key to Making Money! “Like” this article on Facebook; have your say on Twitter; register to receive our bi-weekly Market Intelligence Report newsletter (see sample here , sign up in top right hand corner)
An article on Zero Hedge tonight says fun can be had with fake statistics…and that the 5 percent “increase” in US household income is pure illusion.
I know selected stats can yield some marvelous impressions, but how can US life be getting better than ever…
With real unemployment at 23 percent?
With 43,000,000 getting their meals courtesy of the US government?
With insurance companies deserting Obamacare?
With Trump ahead of the candidate backed by the both Parties?
With Trump ahead of the candidate backed by the media?
With half of America without cash to pay a $500 bill?
With millions of corporate lay-offs?
With retailers–large, small, Mall closing their doors?
With “Services” erosion?
With credit card and student debt maxed out?
With International shipping companies going broke?
With road and rail transportation on the skids?
With tent cities for the homeless and unemployed?