Wars and depressions largely characterize the periods of time where there have been significant run-ups in the level of the U.S. National Debt Burden per Capita [i.e. the U.S. National Debt Burden per Capita-to-income Index], with the debt taken on to support the costs of the U.S. Civil War and World War II being the most significant. Today… it is perhaps most comparable to the Great Depression. [Take a look.] Words: 326
So says Craig Eyermann (www.mygovcost.org) which Lorimer Wilson, editor of www.munKNEE.com (Your Key to Making Money!), has further edited ([ ]), abridged (…) and reformatted below for the sake of clarity and brevity to ensure a fast and easy read. The author’s views and conclusions are unaltered and no personal comments have been included to maintain the integrity of the original article. Please note that this paragraph must be included in any article re-posting to avoid copyright infringement.
Eyermann goes on to say, in part:
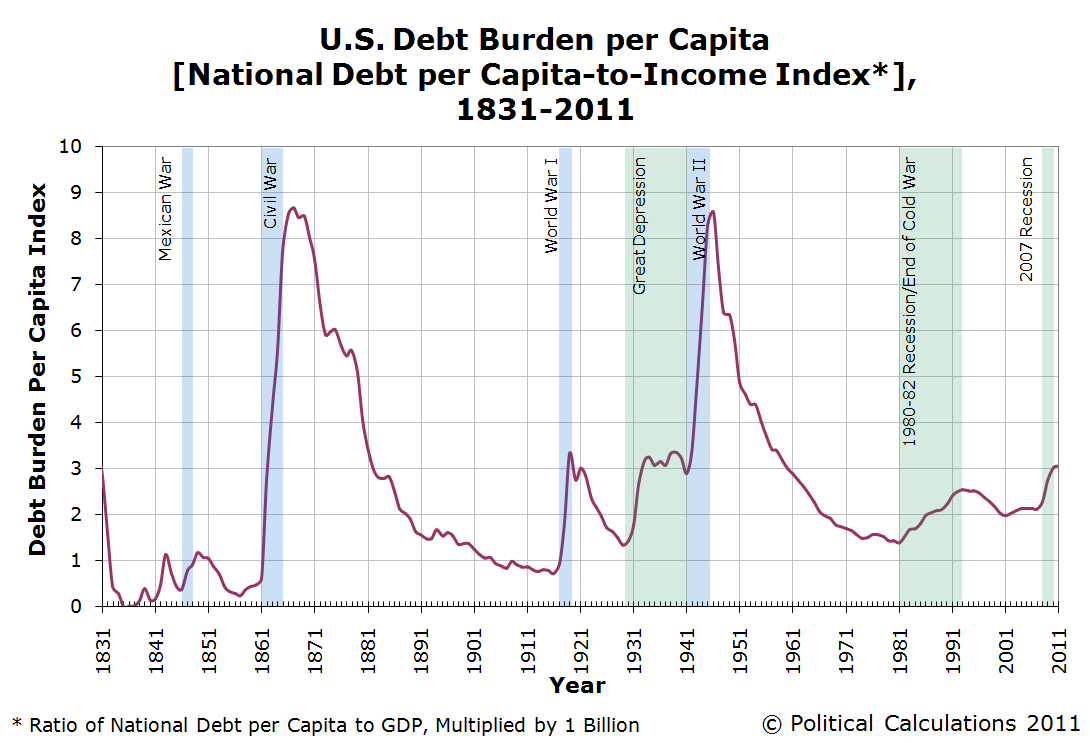
Throughout all this time the National Debt Burden per Capita has only fallen when the United States government curtailed its elevated level of spending. Typically, that has been solely the result of spending cuts following periods of conflict, rather than tax increases. Before 1913, there was no income tax in the United States, yet the federal government in those days succeeded in lowering the National Debt Burden per Capita primarily by shrinking government spending after running up debt and instead encouraging economic and population growth. That may be a lesson that today’s politicians can well afford to learn…
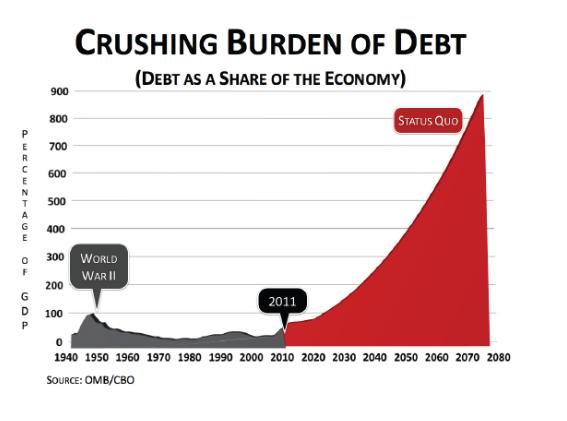
Finally, let’s see what is in store for the future, if the U.S. continues on its current path:
*http://www.mygovcost.org/2011/11/04/the-u-s-national-debt-burden-per-capita/
Related Articles:
1. The U.S. is Headed Toward a Complete and Utter Collapse of its Financial System
The U.S. is headed inexorably toward a systemic failure, a complete and utter collapse of the financial system. TARP and all the other machinations have not improved the underlying insolvency of the banking system. They have, however, deferred a collapse and ensured that it will ultimately be worse. [Let me explain.] Words: 1385
The internet is awash (drowning?) in hundreds of doom and gloom videos providing dire warnings of coming world depression, food shortages, rioting in the streets, rampant (hyper) inflation, deepening banking crisis, economic apocalypse, financial Armageddon, the demise of America – well, you get the idea. Below is a small sample of such videos with a hyperlink to each. Sit back with your favorite beverage (or two/three!), turn up the volume (some of the music is foreboding) and look over the abyss into the pit of financial and economic despair that some see as about to erupt and engulf us in the months/years ahead. Take heed – you are being forewarned!
3. The Global Debt Clock: A World Debt Comparison
The clock is ticking. Every second, it seems, someone in the world takes on more debt. The idea of a debt clock for an individual nation… [is old hat – see links below to many such debt clocks – but] our clock (here) shows the global figure for all (or almost all) government debts in dollar terms. Words: 300
4. These 10 Charts Illustrate America’s Disastrous Fiscal Condition – Take a Look (and Weep)!
By now nobody should have any doubts as to just how disturbing America’s fiscal debacle is. For those naïve and innocent few who still think there is a Hollywood ending with a pot of gold awaiting everyone at the end of the rainbow, we present the following “10 essential fiscal charts” from the Pew Policy Institute.