Gold price swings occur somewhat predictably [month after month and] year after year. What causes this, to what magnitude does it occur and most importantly – how can we profit? [Let me answer those questions.] Words: 890
So says Sam Kirtley (www.skoptionstrading.com) in edited excerpts from his original article* which Lorimer Wilson, editor of www.munKNEE.com (Your Key to Making Money!) and www.FinancialArticleSummariesToday.com (A site for sore eyes and inquisitive minds) has edited ([ ]), abridged (…) and reformatted (some sub-titles and bold/italics emphases) below for the sake of clarity and brevity to ensure a fast and easy read. The article’s views and conclusions are unaltered and no personal comments have been included to maintain the integrity of the original article. Please note that this paragraph must be included in any article re-posting to avoid copyright infringement.
Kirtley goes on to say, in part:
As we all know, two things affect the price of all things tangible and intangible – supply and demand…Gold supply stays remarkably fixed as it is mined at a very consistent rate year round…given that it takes around a decade to bring a new find into production. [Gold demand, and as such, the gold price,] is attributed to variations in [buying and sellings] during different times of the year…
Monthly Seasonal Fluctuations in Gold, 1969-2011
Below is the average monthly trend in gold prices since 1969… [which shows that,] on average, gold has risen every month over the last 43 years.
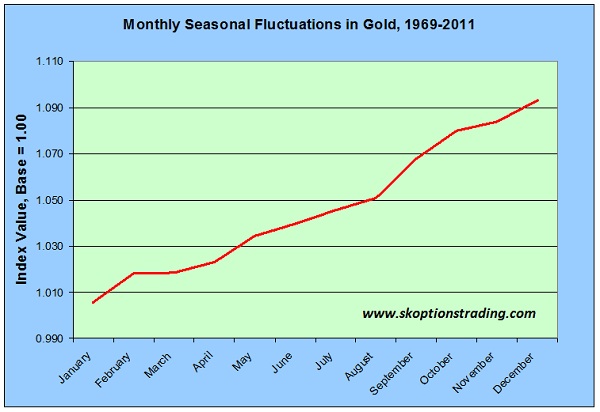
The above conclusion is of no use to us in terms of playing the seasonal shifts…[as, according to] the chart, there is no “best” time of year to buy or sell. Any time is good as the returns are linearly positive. Hence, further analysis is required.
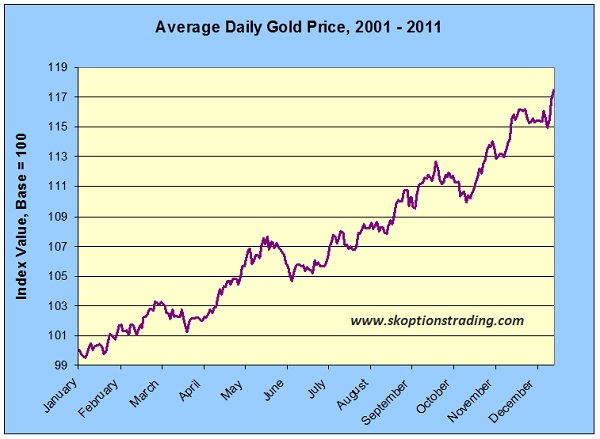
Average Daily Gold price, 2001-2011
This next chart overcomes the limitations of the original. Firstly, we have increased our observations from 12 (monthly averages) to 250 (number of days gold is traded each year – generally). As the number of data points increases so too does the detail of the line. One can analyse trends not just over months but weeks and even days and a clearer pattern emerges. Secondly, we have narrowed down our data range from 43 years to 11, giving us more timely information. Needless to say, the early post float gold market was quite different than what it has developed into over the last decade or so, hence removing that less relevant data paints a clearer picture.
The Summer Doldrums (late April through early July)
[As can be seen in the above chart,] between late April and early July gold has been very flat over the last 11 years with an average rise of…just under 1.3% for the period, which corresponds to an annualized return of 6.1%, paling in comparison to the average return annually between 2001 – 2011 of around 19%.Who in the world is currently reading this article along with you? Click here
These slow months are known as the summer doldrums…Demand for gold will correlate somewhat with global economic activity and with that activity slowing in summer, so too does the demand for gold. A key part may also be simply the perception of the summer doldrums, investors expect things to be quiet around this time of year and therefore refrain from taking large positions, which results in the market being more subdued in a self fulfilling prophecy.
The India Harvest & Wedding Effect (August through September)
The August/September bull period is a little easier to explain. This time of year coincides with the end of harvest in Asia/India. Agricultural producers and farmers in these relatively poor nations…traditionally store their wealth in gold and with huge numbers of producers doing the same the gold prices rise…
Gold holds an important place in Indian culture, especially in the wedding season…and gold is often given as a wedding gift. Jewellers in the developed world also contribute to the September rush. In order to have sufficient quantities of jewellery manufactured and ready for delivery in November prior to the Christmas boom, jewellers traditionally acquire the gold they need in August/September.
The above are contributing factors to the seasonal variation observed and should be included for consideration when formulating a trading strategy.
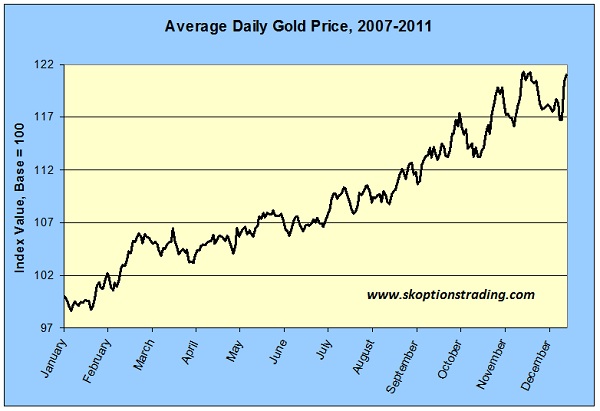
Average Daily Gold Price, 2007-2011
As with the 1969-2011 graph but to a lesser extent, the chart above isn’t as timely as we’d like. So once again we reduce the time horizon, this time from 11 to 5 years.
Using Seasonality to Predict Future Gold Prices
Interpolating the graph above on current gold prices, we can find what seasonality suggests gold prices could be, at any future day in the coming year(s). Here is what our seasonality models predict future prices to be relative to the February 8th price of $1746:
| Date | Model Used | 2001 | 2007 | 2009 |
| March 8 2012 | $1,774 | $1,814 | $1,820 | |
| May 8 2012 | $1,820 | $1,835 | $1,881 | |
| July 8 2012 | $1,820 | $1,839 | $1,898 | |
| September 8 2012 | $1,908 | $1,941 | $2,111 | |
| November 8 2012 | $1,954 | $2,053 | $2,217 | |
Interestingly there are 3 values over the magic $2,000 per troy ounce mark that some are picking will eventuate in 2012.
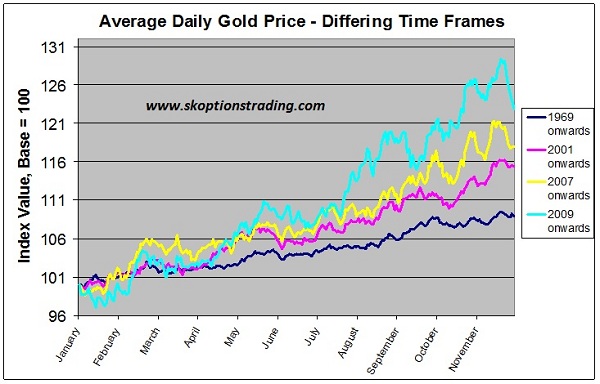
Average Daily Gold Price Historic Trends
Below…gold seasonality is compared over four different time frames from which we can see that the peaks and troughs closely correspond in each time frame and, as such, can conclude that gold definitively follows seasonal patterns and has done for some time…
Conclusion
In summary, gold definitely follows seasonal patterns. In the long run, one can likely profit from these patterns, but they are not a hard and fast rule…We suggest that seasonality is not a strategy in [and of] itself, however, it…[should be taken into consideration when] trading gold and gold options.
*http://www.skoptionstrading.com/updates/2012/2/10/gold-seasonality-can-we-profit-from-it.html
Why spend time surfing the internet looking for informative and well-written articles when we do it for you. We assess hundreds of articles every day, identify the best and then post edited excerpts of them to provide you with a fast and easy read. Sign-up for Automatic Receipt of Articles in your Inbox and follow us on
FACEBOOK | and/or
TWITTER so as not to miss any of the best financial articles on the internet.
Related Articles:
1. Gold: $3,000? $5,000? $10,000? These 151 Analysts Think So!

151 analysts maintain that gold will eventually reach a parabolic peak price of at least $3,000/ozt. before the bubble bursts of which 101 see gold reaching at least $5,000/ozt., 17 predict a parabolic peak price of as much as $10,000 per troy ounce and a further 13 are on record as saying gold could go even higher than that. Take a look here at who is projecting what, by when and why. Words: 844
2. History Says Silver Could Become the Next 10-Bagger Investment! Here’s Why

If you concur with the 159 analysts (see below) that maintain that physical gold is going to go parabolic in price in the next few years to $3,000, $5,000 or even $10,000 or more then you should seriously consider buying physical silver. Why? Because the historical gold:silver ratio is so way out of wack that silver should appreciate much more than gold as it goes parabolic in the years to come. Indeed, silver could easily reach $100 – $200 per troy ounce, maybe even $300 and conceivably in excess of $400 depending on how high gold goes. The aforementioned may be hard to believe but an analysis below of the historical price relationship between silver and gold suggests that such will most likely occur if gold does, indeed, go parabolic. Take a look. Words: 1423