[No one would argue that] diversification is not a sound investment practice but exactly how much risk reduction, in actual numbers, is obtained through application of this philosophy? This analysis is an attempt to quantitatively determine its relevance – [and you will be surprised by the answer. Read on!] Words: 1317
So say Dr. Kris, (http://stockmarketcookbook.com) and Pat Glenn, in edited excerpts from their original article* which Lorimer Wilson, editor of www.munKNEE.com (Your Key to Making Money!), has edited below for length and clarity – see Editor’s Note at the bottom of the page. This paragraph must be included in any article re-posting to avoid copyright infringement.
The article goes on to say, in part:
Everyone assumes that broad asset class diversification in an investment portfolio is advantageous. [Read: Asset Allocation: How Sound is the Foundation of Your Portfolio Pyramid?] The major benefit is to reduce the risk associated with events that can trigger a decline in any one asset class. By holding a variety of asset classes that are mostly uncorrelated with one another, the investor hopes to avoid those catastrophic occurrences that completely wipe out years of gains, such as what happened during the credit crisis of 2008. Further, diversification makes financial planning more reliable and predictable by reducing the variations in portfolio performance from year to year.
Setup
The ideal tool for performing the analysis is Modern Portfolio Theory (MPT), a Nobel Prize-winning approach utilizing complex mathematics to tell you how to best allocate your funds among various asset classes to minimize risk.
Risk can be looked at as fluctuations in portfolio returns. In MPT, risk is measured by a statistical term called the standard deviation. [For more on MPT read: Understanding Systematic Risk, Modern Portfolio Theory and the Efficient Frontier] It is this quantity that MPT seeks to minimize in recommending portfolio allocations…
The portfolios considered here used monthly total return data taken from January 1928 through May 2011 for each of the following 10 asset classes:
- Large-Cap U.S. Stocks
- Small U.S. Stocks
- Long-Term Corporate Bonds
- Long-Term Government Bonds
- Intermediate-Term Government Bonds
- 30-day U.S. Treasury Bills
- Real Estate Investment Trusts (REITs)
- International Stocks
- International Bonds
- Gold
Each of these asset classes are themselves composed of a broad diversification of assets within that class. This article does not address that need, only the benefits of diversification among various classes.
Baseline
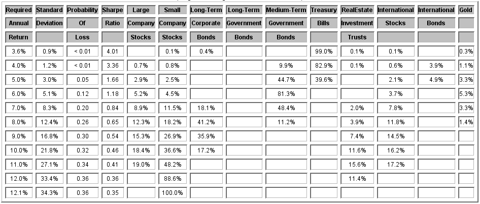
The methodology used in this analysis was to first establish a baseline return/risk table using all 10 candidate asset classes (Table 1 below). You’ll see that the table contains certain measures of risk defined as follows:
- Standard Deviation – statistical measure of portfolio return fluctuation around the target return.
- Probability of Loss – chance of that portfolio losing value in any one year.
- Sharpe Ratio – a measure of risk versus reward with larger numbers being better.
This baseline data is shown in Table 1 along with the current ten asset class portfolio allocations (through May 2011.)
Table 1. Baseline portfolio incorporating all ten candidate asset classes.

Methodology
The next step was to remove each asset class one by one in each of successive rounds and to assess its effect on the measures of risk. At the end of each round we chose to eliminate that asset class that increased the measures of risk the most. This was repeated for eight rounds until only two asset classes remained. Eliminations required examination of 52 separate portfolios (10+9+8+7+6+5+4+3).
Home Delivery Available! If you enjoy this site and would like to have every article sent automatically to you then go HERE and sign up to receive Your Daily Intelligence Report. We provide an easy “unsubscribe” feature should you decide to opt out at any time.
Pass it ON! Tell your friends and co-workers about us. We think munKNEE.com is one of the highest quality (content and presentation) financial sites on the internet and our current readers seem to be confirming that. Visits have been doubling yearly and pages-per-visit and time-on-site continue to reach record highs.
Spread the word. munKNEE should be in everybody’s inbox and MONEY in everybody’s wallet!
By using the above measures of risk as our benchmark, asset classes were eliminated from consideration in each successive round in the following order:
- International Bonds
- Long-Term Government Bonds
- Real Estate Investment Trusts
- Gold
- International Stocks
- 30-day U.S. Treasury Bills
- Large U.S. Stocks
- Either Intermediate-Term Government Bonds or Long-Term Corporate Bonds depending on target return
Results
Tables 2a and 2b show the measures of risk using only two asset classes in the MPT analysis. There are two tables because different asset class combinations are preferable for the most conservative portfolios (target returns up to and including 7%) and the more aggressive ones (target returns 8% and above).
| Required | Standard | Probability | Sharpe | Small | Medium-Term |
|---|---|---|---|---|---|
| Annual | Deviation | Of | Ratio | Company | Government |
| Return | Loss | Stocks | Bonds | ||
| 5.5% | 4.6% | 0.12 | 1.19 | 1.8% | 98.2% |
| 6.0% | 5.3% | 0.13 | 1.14 | 10.1% | 89.9% |
| 7.0% | 8.7% | 0.21 | 0.81 | 25.0% | 75.0% |
| Required | Standard | Probability | Sharpe | Small | Long-Term |
|---|---|---|---|---|---|
| Annual | Deviation | Of | Ratio | Company | Corporate |
| Return | Loss | Stocks | Bonds | ||
| 8.0% | 12.8% | 0.27 | 0.62 | 34.3% | 65.7% |
| 9.0% | 17.3% | 0.30 | 0.52 | 50.4% | 49.6% |
| 10.0% | 22.4% | 0.33 | 0.45 | 66.3% | 33.7% |
| 11.0% | 27.8% | 0.35 | 0.40 | 82.1% | 17.9% |
| 12.0% | 33.6% | 0.36 | 0.36 | 97.8% | 2.2% |
| 12.1% | 34.4% | 0.36 | 0.35 | 100.0% |
You can see from the tables that returns are best realized by small-cap stocks and medium-term government bonds in conservative portfolios, and by small-cap stocks and long-term corporate bonds (investment grade) in the more aggressive ones. The inclusion of small-cap stocks especially in the more aggressive portfolios should come as no surprise because it is this asset class that is capable of generating the highest returns over the long haul. In fact, it is because of using only small-cap stocks to generate returns in the two candidate model that returns below 5.5% are completely unachievable (but so are very low levels of risk).
Now let’s see how these results compare to the classical model of using 10 asset classes.
Comparison of results
Table 3 presents the risk differences associated with reducing ten asset classes to only two.
| Required | Standard | Probability | Sharpe |
|---|---|---|---|
| Annual | Deviation | Of | Ratio |
| Return | Loss | ||
| 6.0% | 0.2% | 0.01 | -0.04 |
| 7.0% | 0.4% | 0.01 | -0.03 |
| 8.0% | 0.4% | 0.01 | -0.03 |
| 9.0% | 0.5% | 0.00 | -0.02 |
| 10.0% | 0.6% | 0.01 | -0.01 |
| 11.0% | 0.7% | 0.01 | -0.01 |
| 12.0% | 0.2% | 0.00 | 0.00 |
Discussion
What this analysis shows is truly astonishing and surprising. You can see that the reduction in the number of asset classes has a relatively insignificant effect on risk. I’m betting few folks would have expected this result!
To summarize all this into one number, you are increasing your overall level of portfolio risk by only about 1 part in 20 by decreasing the number of candidate asset classes from ten all the way down to two. This is based on the general numerical increase in the values of the risk measures as measured from their baselines.
An historical comparison
Looking at this from a historical perspective, let’s see how well a portfolio with only two asset classes would have fared against a traditional portfolio with all ten. Table 4 shows the results of actually following the recommended MPT allocations – with monthly rebalancing – from January of 1928 through May of 2011.
| Required | Ten Asset Classes | Two Asset Classes | Differences | |||
|---|---|---|---|---|---|---|
| Return | Return | SD | Return | SD | Return | SD |
| 6.0% | 7.1% | 7.3% | 8.0% | 8.9% | 0.9% | 1.6% |
| 7.0% | 8.2% | 10.1% | 9.1% | 11.1% | 0.9% | 1.0% |
| 8.0% | 8.6% | 12.6% | 10.2% | 13.5% | 1.6% | 0.9% |
| 9.0% | 9.1% | 14.5% | 10.9% | 15.7% | 1.8% | 1.2% |
| 10.0% | 10.1% | 16.7% | 11.4% | 17.6% | 1.3% | 0.9% |
| 11.0% | 10.9% | 18.8% | 11.7% | 19.2% | 0.8% | 0.4% |
| 12.0% | 11.8% | 19.9% | 11.8% | 20.5% | 0.0% | 0.6% |
To read this table, the Return under each model is the actual return the portfolio would have realized at the required return level given in the first column, and SD is the risk defined by the standard deviation.
Let’s look at an example. To achieve a 10% required compounded average annual return, a 10 candidate asset class portfolio would have achieved its goal and would have actually returned 10.1% at a risk of 16.7%. That same 10% targeted return attempted using only two asset classes would have actually produced a greater return, 11.4%, with only a slightly higher standard deviation of 17.6%. [Read: Warren Buffett: Diversification is Nothing More Than Protection Against Ignorance]
It is interesting to note that the portfolios composed of only two asset classes exceeded their targets more so than their ten asset class counterparts. This is due to the fewer choices available to the mathematics of MPT in its attempts to achieve, at least, the required return while also minimizing the level of risk but in so doing, the level of resultant risk is commensurately slightly higher.
Conclusion
The takeaway from this article should be to note that it doesn’t take broad asset class diversification to adequately achieve one’s investment goals with a reasonable level of reward versus risk. [In fact,] your nest egg needn’t be diversified among more than the two carefully selected asset classes discussed above for you to realize your desired long-term return at minimum risk…
* http://stockmarketcookbook.com/blog/?m=201107 (To access the article please copy the URL and paste it into your browser.)
Editor’s Note: The above article has been has edited ([ ]), abridged (…), and reformatted (including the title, some sub-titles and bold/italics emphases) for the sake of clarity and brevity to ensure a fast and easy read. The article’s views and conclusions are unaltered and no personal comments have been included to maintain the integrity of the original article.
Related Articles:
1. Understanding Systematic Risk, Modern Portfolio Theory and the Efficient Frontier

Risk inherent to the entire market or market segment is referred to as systematic risk and modern portfolio theory says that a blend of investments has the potential to increase overall return for a given level of risk, and/or decrease risk for a given return that the investor is trying to achieve. The expected risk/return relationship is known as the efficient frontier. [If you have a portfolio of investments then you need to fully understand what all this really means and how you can apply it to your portfolio makeup to enhance returns under any circumstances. Let me do just that.] Words: 1325
2. Including 10 – 15% Gold Stocks in Your Portfolio Will Enhance Returns – Here’s Proof
Gold stocks have historically ranked among some of the most volatile asset classes – about three times that of gold bullion – but despite this volatility, our research shows that investors can use gold stocks to enhance returns without adding risk to the portfolio. [Let me explain.] Words: 560
3. Asset Allocation: How Sound is the Foundation of Your Portfolio Pyramid?

Regardless of the size of your financial pyramid, without a core-holding foundation, you are building it on sand. Core holdings are for protection, not for profit. They function as insurance against a catastrophe. [Let me explain.] Words: 754
4. Portfolio “Diversification” Can Kill Your Portfolio Returns – Here’s Why

Most investors don’t know anything more about diversification than you “shouldn’t put all your eggs in one basket” [but] spending some time trying to understand the ways you might be shooting yourself in the foot could seriously enhance your portfolio returns and stop catastrophic risk. [There are some advantages to diversification if you REALLY know what you are doing but the shortcomings can go a long way towards killing your portfolio returns. In this article we identify what they are and how best to avoid them.] Words: 1055
5. Warren Buffett: Diversification is Nothing More Than Protection Against Ignorance

NOT putting all your eggs in one basket makes intuitive sense to many investors. Indeed, evidence indicates that putting more eggs in your basket may actually crack your portfolio, not protect it. Words: 515