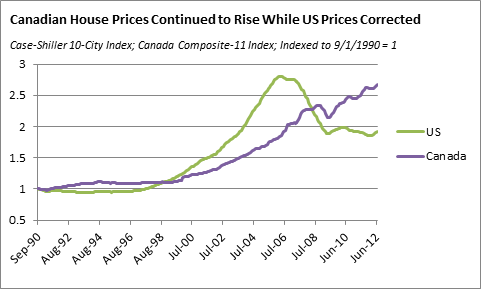
According to the Case-Shiller 10-City index Canadian house prices only appreciated by 84% between 1990 and 2006 compared to 181% in the U.S.. However, as U.S. prices plunged by almost 33% between the peak in April 2006 and the trough in May 2009, the chart below shows that Canadian home prices continued to rise, driven by very low interest rates and relatively benign unemployment. By July 2012, they had reached similar heights as U.S. prices before their decline and fall. I believe that house prices and consumer debt levels are overextended in Canada and that a “Minsky-moment” may be developing in Canadian credit markets. [Let me explain why I have come to that conclusion.] Words: 1892
So says Bard Luippold, Corporate Finance Manager for Meracord LLC, in edited excerpts from his article* posted on Seeking Alpha entitled (Uh) Oh Canada! A Developing Minsky Moment In Canadian Real Estate?
Lorimer Wilson, editor of www.munKNEE.com (Your Key to Making Money!), has edited the article below for length and clarity – see Editor’s Note at the bottom of the page. This paragraph must be included in any article re-posting to avoid copyright infringement.
Luippold goes on to say, in part:
(Click to enlarge)
House Prices and Wealth
In an excellent recent article in the Financial Analysts Journal, Mitsuro Mizuno and Isaac Tabner find powerful, “long-term mean-reverting relationships between house prices and other macroeconomic variables-in particular, GDP per capita.” They go on to write:
“In fact, despite prolonged cyclical pushes away from the mean, we present evidence indicating a powerful deterministic relationship between detrended house prices and the macroeconomic variables examined. Hence, when prices deviate from the mean, the question is not if they will revert but when.”
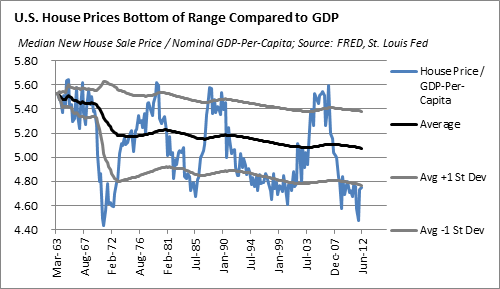
Average American House Price Divided By GDP Per Capita
Approximating Mizuno and Tabner’s method, the chart below shows U.S. median new home prices divided by nominal GDP-per-capita from 1963 through the second quarter of 2012…[which] fluctuated between 4.4x GDP-per-capita and 5.6x GDP-per-capita. The 2006 peak in prices coincided with a cyclical peak in the price-to-GDP ratio and the subsequent plunge in prices, and weak recovery, has kept the ratio below its lower standard deviation band for over three years now. The implication of the chart is that it continues to be a great time to buy residential real estate in the United States.
 (Click to enlarge)
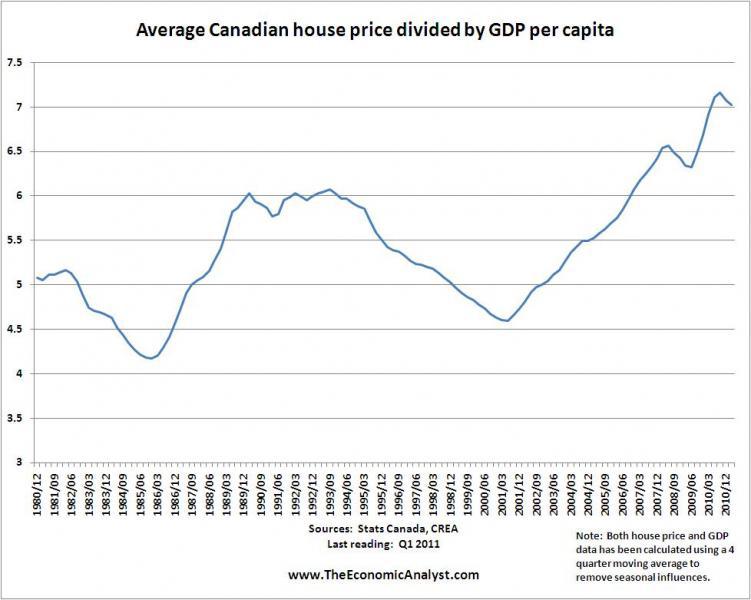
Average Canadian House Price Divided By GDP Per Capita
That is not the case in Canada. The average house in Canada is currently selling at 6.85x GDP-per-capita, using the August 2012 average house price from the Canadian Real Estate Association ($350,192) and a projection for Canadian GDP-per-capita of $51,147 for 2012 from the IMF. This is at the top of the range over the last 30 years – actually 20% above the previous cycle peak of around 6x GDP-per-capita (see chart below from The Economic Analyst).
 (Click to enlarge)
The approximate low for the ratio in the last cycle was 4.5x GDP-per-capita. If the ratio declined to the bottom of the cycle over the next five years, with nominal GDP-per-capita growing at 2.5% per year, average house prices in Canada would decline by 26% by 2017, or roughly 9% per year.
Canadian Home Ownership Costs as a % of Household Income
Other indicators corroborate this analysis. Indeed, Canadian home ownership costs as a percentage of household income are a bit less extreme than house prices/GDP-per-capita, though also close to the highs of the previous cycle from 1990. Royal Bank of Canada’s August 2012 Housing Trends and Affordability report shows housing costs at 43.4% of household income for one-story bungalows and 49.4% for two-story homes, both 4-to-5 percentage points above long-term averages and significantly above the lows from the previous cycle (see referenced report for national and regional charts and commentary).
Canadian Household Debt
Also, Canadian household debt in general – including home mortgages, credit cards, student loans and other types of debt – has risen to multi-decade highs compared to income and to assets (see chart below from Royal Bank of Canada).
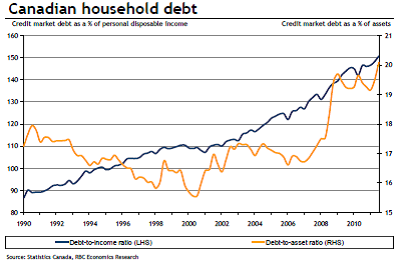
The IMF recently warned about Canadian household debt levels – which have continued to march steadily higher since the 2009 recession – when it downgraded Canada’s future growth prospects. After the debt-to-income ratio hit 152.98% in the third quarter of 2012, Bank of Canada Governor, Mark Carney, declared “Our greatest domestic risk relates to household finances.”
A Troublesome Situation
What I find particularly troublesome about this picture is that mortgages make up the largest piece of Canada’s household debt and the 30-year fixed mortgage does not exist in Canada. All loans are fixed for 5-years and then variable to some extent thereafter. In an extremely low interest rate environment – with Bank of Canada policy rates at 1%, down from over 4% just a few years ago – credit has been very affordable. However, when Bank of Canada begins to normalize interest rates, affordability will deteriorate for variable rate borrowers, just as it did for adjustable rate borrowers in the U.S. in 2006-07. BOC already raised rates from 0.25% to 1% during 2010 and has been preparing markets for further rate hikes in 2013, with governor Carney saying in July that “global monetary policy isn’t a cut-and-paste” and “there is a very small amount of excess capacity in the economy, rates are at 1 percent, they are very low.”
Don’t Delay!
– Go here to receive Your Daily Intelligence Report with links to the latest articles posted on munKNEE.com
– It’s FREE and includes an “easy unsubscribe feature” should you decide to do so at any time
– Join the informed! 100,000 articles are read every month at munKNEE.com
– All articles are posted in edited form for the sake of clarity and brevity to ensure a fast and easy read
– Get newly posted articles delivered automatically to your inbox
– Sign up here
Not If … But When
According to economist Hyman Minsky’s Financial Instability Hypothesis, each credit cycle has three distinct stages:
- Stage 1- Hedging: The incremental borrower is a bargain-hunter who is able to make principal and interest payments out of current cash flow. In this stage, it is real demand for assets that begin driving prices higher.
- Stage 2 – Speculative: As asset prices rise, the Hedging stage gives rise to the “Speculative” stage, where cash flows are only enough to service the interest on the debt and the principal must be rolled over when it comes due. In this stage, real asset demand is giving way to financial demand as a key driver of continued appreciation.
- Stage 3 -Ponzi: The final stage is the “Ponzi” stage, where cash flows are not enough to even service the interest payments and the borrower is relying on significant continued asset price appreciation just to stay afloat. In this stage, financial demand is the key driver of higher asset prices, as lenders “have to keep dancing until the music stops” (to paraphrase Citigroup’s former CEO, Chuck Prince).
Finally, the music does stop. At the height of the Ponzi stage, a tipping point is reached where “Ponzi-borrowers” lose confidence and begin to run for the exits, causing asset prices to fall and financial conditions to deteriorate (a so-called “Minsky moment”).
Minsky’s theory is consistent with George Soros’ theory of reflexivity, which proposes that actions in the financial sector have significant feedback loops to the real economy. In Soros’ application of reflexivity to credit cycles, credit availability drives asset prices higher, which in turn leads to improving bank balance sheets and increased credit availability. This virtuous cycle spins higher until the supply of new credit begins to plateau – through rising central bank interest rates, a dearth of available capital, etc. – and is not able to continue financing upward movement in asset prices. At this point, the credit cycle peaks and the virtuous cycle turns into a vicious cycle, with falling asset prices feeding back into tighter credit, reduced asset demand, and more falling prices. The dynamics of the U.S. housing market from 1990 to 2009…are a perfect case-study for both theories.
Canada bulls will argue that:
- underwriting standards are high across the Canadian real estate market, giving borrowers the capacity to continue making payments even as the value of their real estate declines and their debt service costs rise. Indeed, RBC researchers are quite sanguine about the prospects for real estate and consumer debt in their housing affordability and household debt reports, referenced above.
- in contrast to mortgages in many U.S. states, Canadian mortgages are full recourse, meaning that lenders can pursue borrowers’ incomes and other assets if they try to walk away from an underwater home.
- housing prices – particularly in British Columbia – are being driven by foreign demand from Asian investors, which is supposedly immune from the Canadian economy and interest rates and,
- even if borrowers begin to default in higher numbers, bulls argue that banks will be insulated from credit losses because all mortgages are insured by providers like the Canadian Mortgage & Housing Corporation.
In essence, bulls argue:
- There are no “Ponzi-borrowers” in Canada because of strong underwriting standards; and,
- There will be no “Minsky-moment” or “negative feedback loop” because banks will be insulated from credit losses by insurance provided by a government with an exceptionally strong balance sheet. Maybe.
However, there are others who argue that a “Minsky-moment” may be beginning. In addition to the potential upward trajectory on policy interest rates, Canadian authorities have recently begun taking additional steps to cool the mortgage market: In June, the Finance Minister, Jim Flaherty,
- reduced the maximum amortization period to 25 years for loans with down-payments of less than 20% and
- tightened underwriting standards for housing expenses and total debt service as a percentage of gross household income.
These actions, combined with slowing demand from foreign investors due to the economic slowdown in China, may have already begun to show up in home sales statistics, with sales dipping 5.8% in August 2012 from July and the “sales-to-new-listings” ratio resuming its downtrend (see here).
Following a 20-year period of strong credit creation and asset price increases, both Minsky and Soros would argue that the period of flattening prices and declining sales is exceedingly risky.
While the large Canadian banks are insured against mortgage losses, mortgage underwriting has made up a large part of their business over the last four years – a trend that may be coming to an end – taking away an important source of revenue to cushion against low loss reserves in other parts of their lending portfolios. Indeed, according to Bank of Canada data, while residential mortgages made up just 28% of chartered banks Canadian dollar assets in January 2008 (C$479.7 billion), they accounted for 56% of Canadian dollar asset growth over the next four years, ending July 2012 at C$858 billion, or 36% of CAD assets for chartered banks. Personal loans, while growing more slowly from 2008-2012, still accounted for almost $408 billion in CAD assets at the end of July 2012 and are not insured against credit losses.
How to Position?
In a recent article on Seeking Alpha, Cam Hui argued that – despite the housing bubbles in both economies – it was time to sell Australia and buy Canada, from an equity and currency perspective, because of Canada’s lower net external funding need and high exposure to basic materials markets.
While I agree that Canada is certainly in a better position than Australia, which has the potential for an Iceland-style run on its financial sector, I disagree that investors should overweight Canada from a country-selection perspective. Canadian equities (EWC) have been underperforming U.S. equities during 2012 and seem overextended from a technical perspective (RSI, MACD – see chart below).
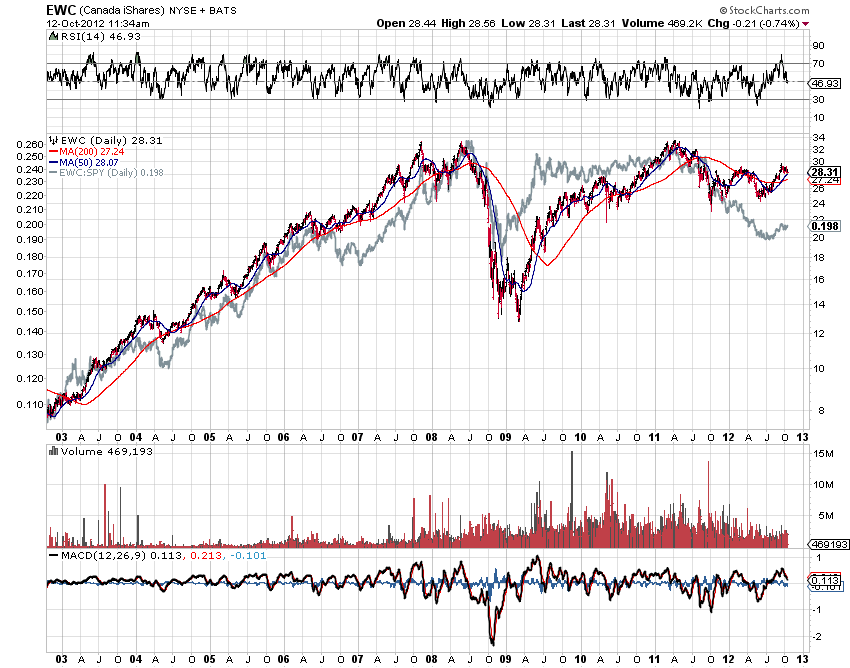 (Click to enlarge)
Within Canadian equities, I would underweight real estate shares like Boardwalk REIT (BOWFF.PK), which is currently trading near multi-year high multiples to cash flow and sales and at a dividend yield (2.88%) that is roughly half of its long term average (4.6%), and Equitable Trust Company (EQGPF.PK). Both stocks have seen significant medium-term rallies and may be near technical tops (see charts below for recent price action).
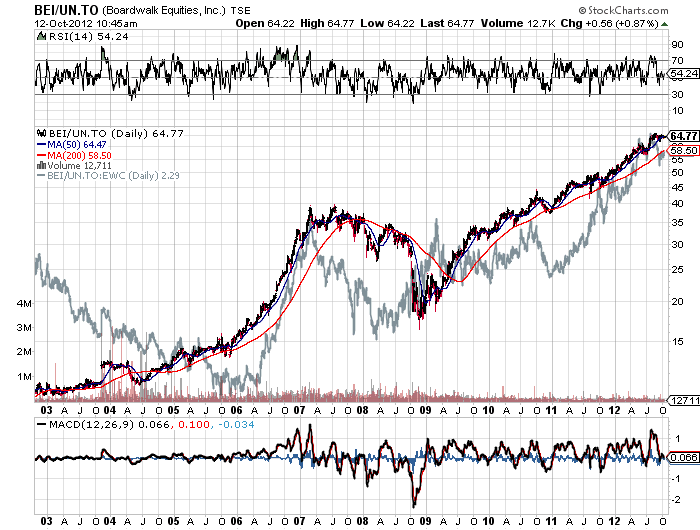 (Click to enlarge)
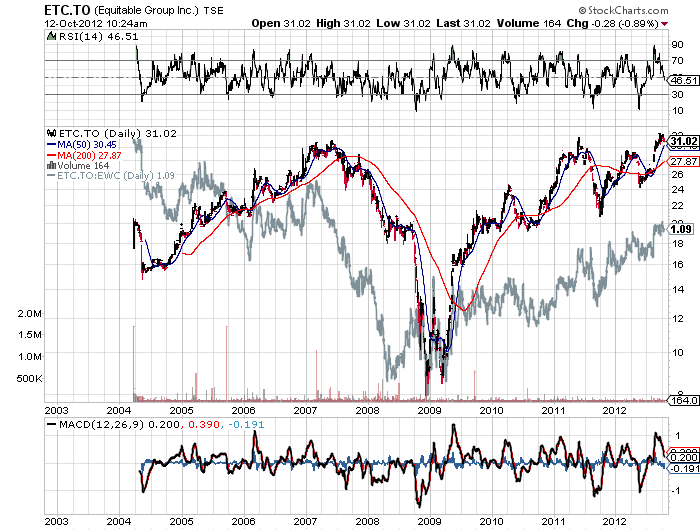 (Click to enlarge)
Disclaimer: Bard Luippold, CFA, is Corporate Finance Manager for Meracord LLC (“Meracord”). This article is prepared by Mr. Luippold as an outside business activity. As such, Meracord does not review or approve materials presented herein. The opinions and any recommendations expressed in this article are those of the author and do not reflect the opinions or recommendations of Meracord
*Source of original article: http://seekingalpha.com/article/921411-uh-oh-canada-a-developing-minsky-moment-in-canadian-real-estate
Editor’s Note: The above post may have been edited ([ ]), abridged (…), and reformatted (including the title, some sub-titles and bold/italics emphases) for the sake of clarity and brevity to ensure a fast and easy read. The article’s views and conclusions are unaltered and no personal comments have been included to maintain the integrity of the original article.
Related Articles:
1. Still NO Housing Bubble in Canada – So What Will Cause Prices to Finally Correct?

Canada’s housing prices continue to escalate [there has been no housing collapse as there has been in the U.S., Spain, U.K., Australia and elsewhere over the past 4-6 years] but concern is rising as to whether they are now, finally, ‘in a bubble’ and about to correct either modestly or severely. This article discusses what would cause a change in direction in Canadian housing prices. Words: 500
2. Will Canada Soon See a 20-30% Correction in House Prices?

Canadians are becoming increasingly vulnerable to a housing correction, exposing them to a perfect storm of high debt and falling assets, the Bank of Canada warns…suggesting that many Canadians have constructed their finances on a house of cards, with ever rising home values the key and vulnerable support. [Sound familiar?] Words: 770
3. Housing Collapse Coming to Canada? House Price-to-Rent Ratios vs. America’s At Peak Suggest So
The ownership premium in Canada’s largest cities is unprecedented, dangerous to new buyers, and unlikely to persist – and if analogies to the U.S. situation at its peak back in 2005 are at all valid, this is bad news. [Let me explain.] Words: 430
4. American/Canadian Home Price Performance Comparisons by Major Cities
The following charts indicate relative performance of US home prices in Phoenix, Los Angeles, San Francisco, Chicago, Las Vegas, New York and Miami to Canadian home prices in Vancouver, Calgary, Toronto, and Montreal. US home prices are reflected in Canadian dollars for comparison purposes. Words: 240
5. Unlike the U.S and U.K, Canada’s Home Prices Are STILL Rising!
Canada, France and Switzerland stood alone among nine markets measured in recording annual price gains, based on second-quarter data, with inflation-adjusted price increases of 5%, 5% and 4%, respectively, compared to declines of 6% in the U.S., the U.K. and Australia, 10% in Spain and 14% in Ireland. In fact, Canada’s home prices have escalated 44% since 2005 – with a high of 68% in Vancouver – and they are up 7.7% in the past 12 months! Words: 1244