While the debate rages on about whether or not gold/silver are in some kind of investment bubble, the facts completely obliterate any possible argument supporting the “bubble” thesis. [Here they are.] Words: 585
So writes Dave Kranzler (www.goldenreturnscapital.com) in edited excerpts from his recent post* on Seeking Alpha entitled Gold In A Bubble? Seriously?
This article is presented by www.FinancialArticleSummariesToday.com(A site for sore eyes and inquisitive minds) and www.munKNEE.com (Your Key to Making Money!) and may have been edited ([ ]), abridged (…) and/or reformatted (some sub-titles and bold/italics emphases) for the sake of clarity and brevity to ensure a fast and easy read. The author’s views and conclusions are unaltered and no personal comments have been included to maintain the integrity of the original article. Please note that this paragraph must be included in any article re-posting to avoid copyright infringement.
Kranzler goes on to say, in part:
Reason #1: There Has Been No “Blow-off” Move Higher Yet
We have yet to see the typical “blow-off” move higher, where investors chase the price of gold higher at all costs. In fact, those who remember the last time gold behaved in “bubble” fashion, 1979-1980, also remember that there were lines of people going out [to] coin shops all over the country and around the block as buyers lined up to chase the price and supply.
Reason #2: “Cash-for-Gold” Businesses Are Still Flourishing
Furthermore, the “cash-for-gold” business is still proliferating and profiting handsomely from people taking their gold/silver jewelry and other sundry “junk” items and selling it for a pretty big discount to the spot price. If gold were exhibiting the traits of a bubble asset, the cash-for-gold business would disappear and we would be seeing ads all over the place for businesses trying to sell into frenzied demand.
Reason #3: Investment in Gold Is Still Less Than 1%
As it stands now, globally institutions have less than 1% of their assets invested in gold:
Given that in 1980, U.S. institutions had 6% of their holdings in gold, it is arguable that the gold bull market has yet to even cycle through the typical second stage of a bull market (1. smart money, 2. institutions, 3. public/blow off bubble) and, based on conversations with numerous national coin dealers, maybe 2% of the public has started to buy physical gold and silver (obviously, they are still selling).
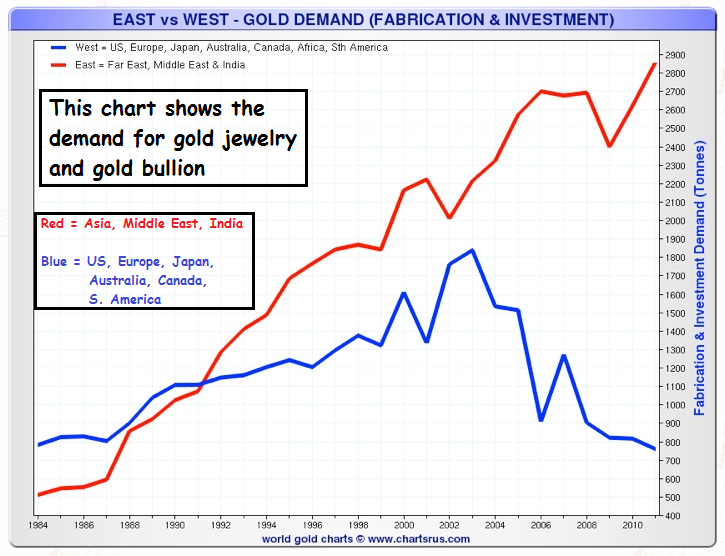
Reason #4: Demand for Gold Is Not Yet Universal
Probably the best the indicator that gold is not even remotely close to being considered in a “bubble” state is this chart below I sourced from King World News, from Chartsrus.com (the black box edits are mine):
(click to enlarge)
The chart [above] shows investment and jewelry demand segmented, for the most part, into eastern and western hemisphere countries. As you can see, since the gold bull market started, western hemisphere demand has declined almost every year since the 2002 peak by a stunning 60%. Concomitantly, the demand in eastern hemisphere countries has increased almost every year. If the gold market were truly in a bubble, that blue line above would be rising at least as fast as the red line and probably faster.
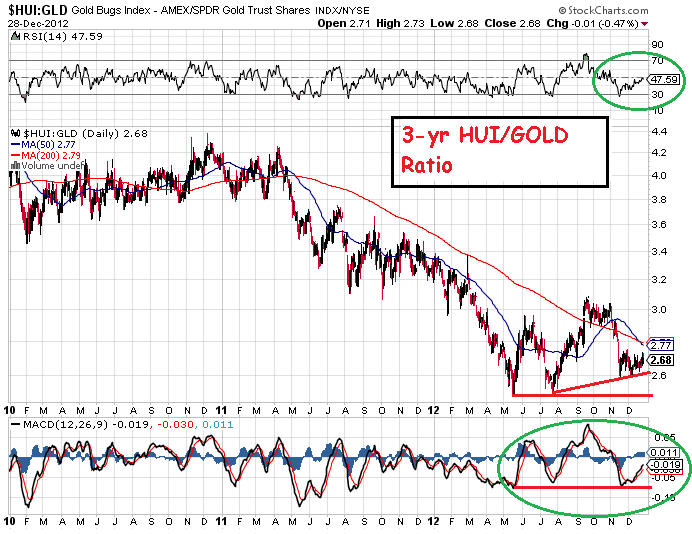
Reason #5: Gold/Silver Mining Stocks Are Currently Oversold Not Overbought
The gold/silver/mining stock market has corrected to the point at which it can be considered technically oversold. The mining stocks particularly represent compelling value right now:
(click to enlarge)
From a fundamental standpoint, the mining stocks, as represented by the HUI Amex Gold Bugs Index of unhedged mining stocks, are as cheap relative to the price of gold as at any time over the last three years. This is actually true going back 10 years. As you can see from the above chart, the HUI/gold ratio chart has consolidated just above a 3-yr low, after testing the 3-yr low twice. To reinforce the potential bullishness of the mining stocks, the momentum indicators represented by the RSI and MACD are moving higher from an “oversold” condition.
Conclusion
Because of the deteriorating fiscal condition of the U.S. and the acceleration in global Central Bank money printing, I expect gold and silver to stage a significant rally starting in early 2013….
[Here is a summary of my]…thoughts on the 2011 gold price peak relative to the last time a long term bull market ended (back in 1980): Long-term bull markets almost always end with a bang, not a whimper, and last year’s price peak was clearly the latter. A 25% rise over a period of about two months last year [does not an] end-of-cycle, blow-off top [make]. No, I think there’s still some room to run for gold if for no other reason than that we haven’t even come close to the “mania” stage that characterizes the end of long-term market moves…[Let me explain further.] Words: 359; Charts: 1
Our subscription service provides detailed technical analysis of where the price of gold, silver and precious metal stocks are going short term (in the next week or two), intermediate term (within the next 3-6 months) and long term (the ultimate top) in each stage of their respective bull runs. This service comes with detailed charting based on conventional technical analysis and our proprietary fractal analysis based on the ’70s. Below are some of our latest comments and rationale for expected price movements in gold without illustative charts which are only available to subscribers. Words: 1000
I am not predicting a future price of gold or the date that gold will trade at $4,000, but I am making a projection based on rational analysis that indicates a likely time period for gold to trade at $4,000 per troy ounce. Yes, $4,000 gold is completely plausible if you assume the following:
Lately analyst after analyst (161 at last count) has been climbing on board the golden wagon with prognostications as to what the parabolic peak price for gold will eventually be. That being said, however, only 51 have been bold enough to include the year in which they think their peak price estimate will occur and they are listed below. Take a look at who is projecting what, by when and why. Words: 644
Since the Financial Crisis erupted in 2007, the US Federal Reserve has engaged in dozens of interventions/ bailouts to try and prop up the financial system…and the amount of money printed is absolutely staggering. As a result of this, inflation hedges, particularly Gold, have been soaring…[but] for gold, for example, to hit a new all time high adjusted for inflation, it would have to clear at least $2,193 per ounce. If you go by 1970 dollars (when gold started its last bull market) it would have to hit $4,666 per ounce. Words: 581
We now have a really strong probability that the correction which started at $1913 on 23 August 2011 has been completed both in terms of Elliott waves and also in terms of time elapsed. If this is correct, the gold price should soon be expressing itself in violent upside action as it moves into the third of third wave which is still targeted to reach $4,500. [Let me explain in detail (with charts) how and why my most recent analyses confirm my earlier target of $4,500.] Words: 1085
According to my 2000 calculations, if interest rates and inflation stay constant over the next 2 years, we could expect to see (with 95.2% certainty) a parabolic peak price for gold of $4,380 per troy ounce by then! Let me explain what assumptions I made and the methods I undertook to arrive at that number and you can decide just how realistic it is. Words: 740
The closing of the gold window back in August 1971 has led governments worldwide to create endless amounts of worthless paper money and the resulting credit bubble has created a world debt exposure of over US$ 1 quadrillion (including derivatives). It has also created perceived wealth for big parts of the world’s population – a wealth which is only backed by promises to pay and by grossly inflated assets. Few people realise that this wealth is totally illusory and will implode considerably faster than the time it took to create it. [Let me explain.] Words: 890
My Fractal Gold chart work is a direct comparison of Gold, today, to the late 70’s Gold Parabola. Thus, “timing” is taken directly from the late 70’s cycle, with price targets created from a combination of the late 70’s Gold price and different technical analysis techniques. We developed a price target back in 2006/ 2007 for Gold to reach the $10,000 to $12,000 range during this Gold Bull and we still stand by that forecast. Let me explain where we are at this point in time.
This is not a typical bull market. Gold is not rising in value, but instead, currencies are losing purchasing power against gold and, therefore, gold can rise as high as currencies can fall. Since currencies are falling because of increasing debt, gold can rise as high as government debt can grow. Based on official estimates, America’s debt is projected to reach $23 trillion in 2015 and, if its correlation with the price of gold remains the same, the indicated gold price would be $2,600 per ounce. However, if history is any example, it’s a safe bet that government expenditure estimates will be greatly exceeded, and [this] rising debt will cause the price of gold to rise to $10,000…over the next five years. (Let me explain further.] Words: 1767
The correlation between the gold price from 1968 until 1979 and from early 2000 until today is an amazing 89.65%! More specifically, the correlation from 1975 until April 1979 and from January 2008 until today is an astonishing 97.83% suggesting that gold will reach an ultimate top of $5,000 per troy ounce before the bubble bursts. Words: 330
It is my contention that the price of gold rallies whenever the U.S. dollar’s real short-term interest rate is below 2%, falls whenever the real short rate is above 2%, and holds steady at the equilibrium rate of 2%. Furthermore, for every one percentage point real rates differ from 2%, gold moves by eight times that amount per year. So if the real rates are at 1%, gold will move up at an 8% annualized rate. If real rates are at 0%, then gold will move up at a 16% rate (that’s been about the story for the past decade). Conversely, if the real rate jumps to 3%, then gold will drop at an 8% rate. [Let me explain.] Words: 982
I believe that the price of gold will… reach… $3,000, $4,000, and even $5,000 [per troy] ounce…during the course of this long-lasting bull market, a bull market that still has years of life left to it…[although] prices will remain extremely volatile – with big swings both up and down along a rising trend…The future price of gold is a function of past and prospective world economic, demographic, and political developments [and in this article] I review some of these developments and trends – so that you can come to your own “golden” conclusions. Words: 3800
We can all speculate about when the next leg up for gold will kick in, but the point for now is to take advantage of the weakness, like many of [the individuals, central banks and financial institutions are doing/suggesting. When the price breaks out of its trading range, are you sure you won’t wish you’d bought a little more? Here’s a sampling of this year’s “gold bugs” and what they’ve been doing about precious metals recently. Words: 1449
The current availability ratio of physical silver to gold for investment purposes is approximately 3:1. So, why is it that investors are allocating their dollars to silver at a much higher ratio? What is it that these “smart” investors understand? Let’s have a look at the numbers and see if it’s time for investors to do as a wise man once said and “follow the money.” Words: 1052; Tables: 1
I’m not surprised that the red “Asia, Middle East and India” line is going upward compared to the Blue (no pun intended) line since all the Blue Countries with the possible exception of Australia are having Fiscal problems which have started to affect their citizens in a very big way! The shrinking middle class in the USA is just starting to come to grips with this reality as ever more “once middle class” folks are now joining the new poor.
Thanks to the Gov’t. bailout of the wealthy BIGS, which has done nothing positive for the rest of the Country, even America’s future is looking grim for the 90+ % that are not Wealthy…
A good indicator of this is the 1.7% COLA those on Social Security got for 2013 while their Medicare costs increased 6 to 9%.
Even those once not too concerned are now getting the message that the Gov’t. is gaming the calculations to make things look far more rosy than they really are; and that realization will encourage ever more to invest in Precious Metals, if they now have anything left to invest with.
 kind of investment bubble, the facts completely obliterate any possible argument supporting the “bubble” thesis. [Here they are.] Words: 585
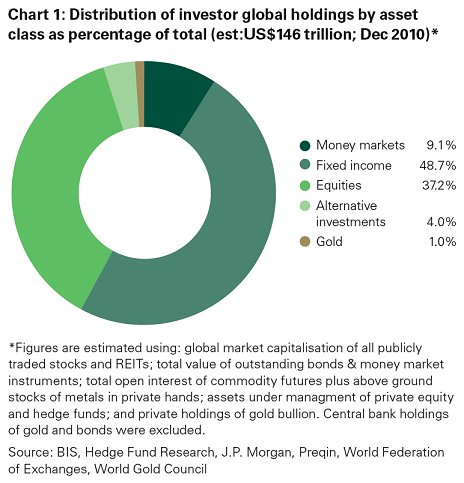


I’m not surprised that the red “Asia, Middle East and India” line is going upward compared to the Blue (no pun intended) line since all the Blue Countries with the possible exception of Australia are having Fiscal problems which have started to affect their citizens in a very big way! The shrinking middle class in the USA is just starting to come to grips with this reality as ever more “once middle class” folks are now joining the new poor.
Thanks to the Gov’t. bailout of the wealthy BIGS, which has done nothing positive for the rest of the Country, even America’s future is looking grim for the 90+ % that are not Wealthy…
A good indicator of this is the 1.7% COLA those on Social Security got for 2013 while their Medicare costs increased 6 to 9%.
Even those once not too concerned are now getting the message that the Gov’t. is gaming the calculations to make things look far more rosy than they really are; and that realization will encourage ever more to invest in Precious Metals, if they now have anything left to invest with.