“Follow the munKNEE.com” via twitter & Facebook
It would seem logical that the precious metals should be moving a lot higher after the FOMC announced its latest QE program. How is it possible that the market is dumping like this, in conjunction with a concomitant decline in the dollar? [Let me] explain from a technical perspective what is happening. Words: 700; Charts: 3
So writes Dave Kranzler (www.truthingold.blogspot.ca/) in edited excerpts from his article* as originally posted on Seeking Alpha under the title What’s Going On With Gold And Silver?.
This article is presented compliments of www.munKNEE.com (Your Key to Making Money!) and may have been edited ([ ]), abridged (…) and/or reformatted (some sub-titles and bold/italics emphases) for the sake of clarity and brevity to ensure a fast and easy read. The author’s views and conclusions are unaltered and no personal comments have been included to maintain the integrity of the original article. Please note that this paragraph must be included in any article re-posting to avoid copyright infringement.
Whether or not you want to believe that the Comex metals markets are manipulated, there is no question that there is a high correlation between sharp market moves in gold and silver and moves in the open interest of Comex gold/silver futures. This has been a pattern that has persisted and repeated for at least the 12 years I’ve been tracking this market.
The cycle goes something like this:
- As the metals move higher, the large hedge funds increase the size of their long position.
- This tends to accelerate as the market momentum to the upside increases.
- At the same time – being that futures are zero-sum market (i.e. for every buyer there’s a corresponding seller) – the commercial segment (largely the so-called bullion banks who make active markets in gold/silver futures, among other bullion market functions) – increases its concentrated short position by a like amount….
What happens to create these sharp sell-offs once the open interest has reached a certain level, is the market starts to experience large offerings of paper, often time in the more illiquid periods of overnight electronic trading during Asian market hours and always right at the Comex floor opens. This sets off the stop-losses set by the large hedge fund computer “black box” models and creates the well-known “waterfall” chart formation that occurs repeatedly over time on the Comex. This has occurred ever day this week on the Comex and this one is today’s:
March Comex Silver – today
 (Click to enlarge)
As you can see, the price of silver has held steady throughout the overnight trading (attributable to the strong physical buying going on right in India and Asia) but, right as the gold floor is opening on the Comex, silver falls right off a cliff. If you run these charts over time, you’ll see that it’s serially repetitive and in conjunction with the liquidation of COT open interest. Call it manipulation or call it what you want, but it’s a real-time event. Eventually the large spec funds “sell out” of a large portion of their long positon, the commercials cover their shorts and the cycle repeats.
Visit FinancialArticleSummariesToday.com – A site for sore eyes and inquisitive minds!
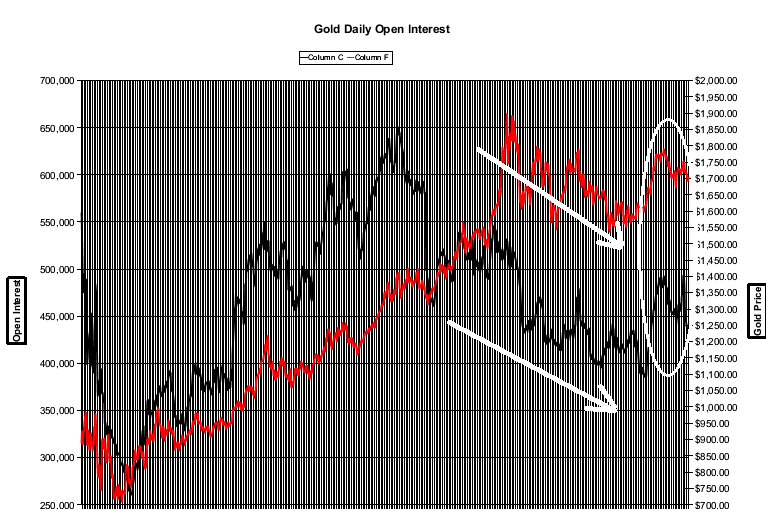
Although the open interest in silver has only dropped about 10k contracts from its recent peak, the open interest in gold has dropped substantially from its peak of 492,000 in early October to yesterday’s 437.6k….
Here’s a chart which shows the dynamic of the open interest climbing and declining with the price of gold over 4 years:
Comex Gold Open Interest vs. Price of Gold
 (Click to enlarge)
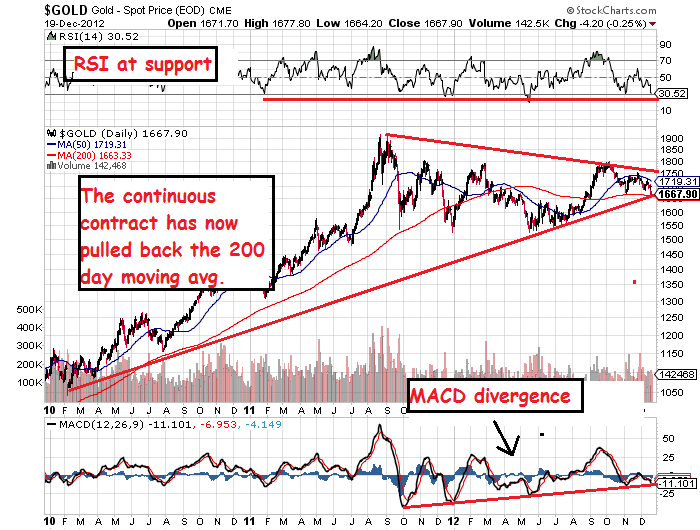
The best chart to show just how irrelevant this current price correction is in the grand scheme of the gold/silver bull market is here:
3-yr Comex Gold
 (Click to enlarge)
The current sharp sell-off in gold/silver is being accompanied by what I call a Comex open interest stop-loss liquidation. This has been a wash/rinse/repeat occurrence for many years during this precious metals bull market. This isn’t the first one and it won’t be the last but, in my view, we getting near the end of this particular Comex paper raid. I suspect that at some point in the next 3-6 months that gold and silver will be started on their way to new all-time highs.
Sign up HERE to receive munKNEE.com’s unique newsletter, Your Daily Intelligence Report
- FREE
- The “best of the best” financial, economic and investment articles to be found on the internet
- An “edited excerpts” format to provide brevity & clarity to ensure a fast & easy read
- Don’t waste time searching for articles worth reading. We do it for you!
- Sign up HERE and begin receiving your newsletter starting tomorrow
- You can also “follow the munKNEE” on twitter & Facebook
* http://seekingalpha.com/article/1075931-what-s-going-on-with-gold-and-silver
Related Articles:
1. Goldbugs, Here’s Why Gold’s Long Bull Run Could Be Over

 Gold is sought after and saved when its price is rising in anticipation of rising inflation, or on concerns created by the collapse of currencies and in the final stage of long bull markets in any asset, prices often continue to rise further for no other reason than that they have been rising so dramatically for so long, making investors confident they can extend expectations for more gains in a straight line into the future, rather than thinking cycles. [That begs the question no gold bug wants to contemplate “Could gold’s long bull run be over?” Let’s try and answer that question.] Words: 814; Charts: 3
2. Is Gold’s 13 Year Run Almost Over?


 [While] the price of gold has gone up for 12 straight years, and is on pace to make it 13 when this year comes to a close, it seems that despite all of the gold bugs calling for the metal to surge to unbelievable highs, major financial institutions are calling for the gold bubble to finally burst in the coming months. [Let’s examine what they and others have to say.] Words: 450


 Gold’s loss of momentum in the past months has predictably brought out calls to short gold. [This article offers] a brief guide to whether you should consider or ignore these [suggestions]. Words: 1184; Charts: 1
4. It’s Time to Seriously Consider SHORTING Gold – Here’s Why


 I view the current market weakness in gold, coupled with the pullback in trader positions, as a shorting opportunity which is strong in terms of reward vs. risk. I have come to that conclusion by questioning the assumptions that many make about it, isolating its fundamental drivers and providing a trading recommendation as to where I believe the price is headed in the future. Let me share my analyses with you. (Words: 1440; Charts: 4; Tables: 1)
5. 7 Indications That Gold & Silver Bearishness Most Likely Will Continue


8. What, Me Worry? Not When You Look at These Monthly Gold & Silver Charts


 Our subscription service provides detailed technical analysis of where the price of gold, silver and precious metal stocks are going short term (in the next week or two), intermediate term (within the next 3-6 months) and long term (the ultimate top) in each stage of their respective bull runs. This service comes with detailed charting based on conventional technical analysis and our proprietary fractal analysis based on the ’70s. Below are some of our latest comments and rationale for expected price movements in gold without illustative charts which are only available to subscribers. Words: 1000
10. Short-term Interest Rates Are Behind the Price Of Gold – Here’s Proof!


