The usefulness of sentiment’s stealth crystal ball is about to be revealed…in this article which will bring us up to date as to the degree of current bearish sentiment regarding both gold and silver using no fewer than 5 sentiment indicators (with 9 illustrative charts), as well as provide the reader with an opportunity to observe the price outcome of previous bearish extremes using these sentiment indicators.
So says John Townsend (http://thedailygold.com) in edited excerpts from his original article* entitled Gold and Silver: Sentiment Reversal is Inevitable.
Townsend goes on to say in further edited excerpts:
When we begin the sentiment indicator discussion we will look at charts of:
- the put/call volume ratio (options) of SPDR’s Gold Trust ETF (GLD) and iShares Silver Trust ETF (SLV),
- the Hulbert’s Gold Sentiment Index,
- the Blees Rating,
- gold’s Commercial and Non-Reportable (futures) traders positioning detailed in the most recent Commitment of Traders Report (COT) from the CFTC, and conclude with
- a daily gold futures price chart that includes the corresponding readings of the Ulcer Index indicator.
First, though. let’s briefly consider the concept of investor sentiment.
My observation is that sentiment’s crystal ball, particularly when observed at an extreme, plays the ultimate trump card in foretelling a market’s reversal of price direction….
Sentiment Extremes
Sentiment extremes, simply put, tell us that:
- there are too many traders at one end of the boat and therefore the boat is about to tip over. Sentiment can strongly suggest that the trade, as some say, has become “crowded”. When someone finally yells “fire” in the “crowded” room there are so many of the market’s participants motivated to get out the same door and in the same direction that most get trampled – unable to reverse their trade fast enough or that
- the trade has simply runs out of buyers or sellers, as the case may be. The extreme price momentum in one direction “exhausts” itself of all available ammunition to continue the trend and is sometimes signaled when someone yells “fire” in the “crowded” room, but often comes to a conclusion unrecognized by most traders as price reverses direction in an unassuming manner or that
- “when everyone is thinking the same thing, then no one is thinking”. The sentiment indicators we will look at today will give us a clear sense as to whether this saying is potentially a significant and foretelling factor in future precious metal price movement.
Yes, there are two players for each trade – the buyer and the seller – and in our present precious metals situation, this leads us to consider the concept of shares moving from “weak” hands to “strong” hands….
You may have heard comments when a particular market bottoms and then begins to trade higher and then continues to trade even higher yet, despite “bad” news, the assertion that the bullish price movement seems to make no sense – that it cannot possibly be sustained. At this time it appears to nearly everyone that:
- the common sense question to ask is how “bad” news, that used to cause a market to go into free fall, now seems to have absolutely no negative effect and to observe that
- as this market continues higher, it always leaves behind those traders stuck in pessimism to declare that the market is “climbing a wall of worry”. That is, the “bad” news continues in the media, yet this particular market’s price reversal continues upwards.
The above thoughts are precisely what make this article’s argument dead on target, in my opinion. That is, sentiment at extremes can and often does trump both technical and fundamental analysis. We are about to examine a number of these sentiment indicators which will leave little doubt that the precious metals market is presently at a sentiment extreme of historical proportion.
As markets usually swing from one price extreme to another, and markets usually swing from one emotional extreme to another (such as fear to greed), I believe the following sentiment indicators and their readings literally guarantee the continued reversal of gold and silver price to the upside.
Let’s now take a look at the 5 sentiment indicators I have prepared for detailing the current gold and silver market sentiment and see what they are telling us.
1. The put / call volume ratio of the options trade of the SPDR Gold Trust ETF (GLD) and iShares Silver Trust ETF (SLV):
The red line in the charts are the ETF’s price movement over the recent 2 years (GLD above, SLV below). The blue line is the put/call volume ratio. This considers the trading day’s volume of puts traded and is divided by the volume of calls traded. Generally, the higher the put/call ratio, the more bearish traders are about the ETF’s likely price movement, while the lower the put/call ratio, the more traders believe the ETF is bullish and going to rally higher. (Both charts courtesy of Schaeffer’s Investment Research.)
 |
| Click on any chart to ENLARGE |

Undoubtedly you have noticed that both charts reveal that the put/call ratio is at the highs of the past two years; meanwhile price is at the lows of the past two years. I will leave it to you to observe the repetitively flip-flop relationship between this sentiment indicator and price movement. For me, anyway, this indicator leaves little doubt as to the upcoming direction of GLD and SLV.
2. The Hulbert Gold Sentiment Index:
The Hulbert Gold Sentiment Index chart below (courtesy of Mark Hulbert’s Newsletters) shows us that gold sentiment at present is even more depressed than at gold’s infamous 2008 low. The first chart is.


3. The Blees Rating:
The Blees Rating is simply a calculation that uses the COT report data on the positioning of commercial traders in comparison to their positioning 18 months previously.
The first chart looks at the price movement of gold since September 2008 in the upper portion of the graphic, and displays the corresponding Blees rating in the lower portion of the graphic. The Blees rating this week, for the second week in a row, is 100. The green bars I added to the chart are intended to draw your attention to price action once a Blees rating of 100 is triggered.

The red bar I added in the chart above connects a Blees rating of 99 with price just before our infamous episode of a two-day price crash in gold. Though I neglected to add another red bar in September 2008, you will notice that nearly the same thing happened at that time. That is, the commercial traders bellied up to the bar with a reading of 94 then apparently and correctly smelled a rat. They backed off and price indeed made one final swoon. Then in early November 2008 they bellied back up to the bar and held a 100 Blees rating for 2 consecutive weeks followed by another week at 99. They nailed the true bottom. I have no doubt they have done it in 2013, as well.
The following chart of $GOLD (courtesy of SmartMoneyTrackerPremium) details the locations of the maximum Blees rating since 2003.

4. The positioning of gold futures traders as reported in the most recent Commitment of Traders (COT) report:
Both charts below are courtesy of GotGoldReport by Mr. Gene Arensberg.
First up is the commercials (dark blue line) and their net positioning of gold futures contracts since 2008. The price of gold is shown in magenta.
This group of traders [the commercials] is considered the smartest of the players and are hedgers by nature. It is indeed rare to find their net positioning anywhere near to just slightly short, as they are now positioned. Incidentally, they are now positioned exactly as when they correctly called the 2008 bottom.

In Mr. Arensberg’s accompanying dialog with these charts he noted that the commercial traders method of operation is to add shorts as price rises and add longs (or sell shorts) as price falls. Interestingly, however, as gold has been raising $150 over the past two weeks, the commercials have been doing just the opposite of their norm. Instead of adding to their shorts as price has gravitated higher, they have reduced their shorts and added to their longs.
Yowzer! My take is that the commercials are essentially saying to the market, “bring it on”.
Now for the chart of the little guys trading gold futures, otherwise known as the non-reportables.
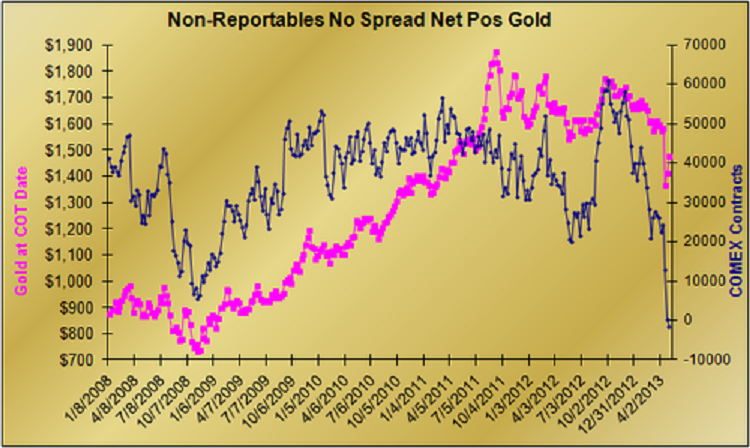
You can see in the chart above that for the first time since 2008 this group (sometimes also known as the ‘dumb money’) has a net position that is just barely short (below ZERO). In effect, this group does not have any skin in the game and that has not been seen before. They have been suckered into losing their net long position and will have to buy, buy, buy when they figure out the trend is up.
5. The daily chart of gold futures (/GC) from 2007 and forward:
I created this chart and have added in the lower panel the Ulcer Index indicator. This is a volatility indicator that measures downside risk. The higher the indicator reads the higher the risk is considered to be if one continues to hold ‘Old Turkey’.
From a sentiment point of view, the higher the indicator reads the scarier the ride for the long investor. I looked at this indicator on the daily gold futures chart back 20 years and I can tell you what we just experienced was the first place roller coaster drop of the past 20 years. If you still have your lunch (like me) you are likely qualified as a “strong hands” investor.

Conclusion
There you have it. Sentiment on GLD and SLV options is crazy extreme:
- Hulbert’s Gold Sentiment Index reveals sentiment is not only more bearish than the 2008 bottom – it’s more bearish than anytime in the past 17 years (at least).
- The Blees Rating has been at the max of 100 for two consecutive weeks.
- The smart money commercials of the Comex gold futures market, despite the $150 rally we have had off the capitulation low a couple of weeks ago, are not being shy. Price has been going up and they have just added to their long positions and reduced their short positions.
- Meanwhile the non-reportables have played themselves right off the field and will have to become buyers to get back in the game.
- The Ulcer Index confirms that gold has taken a hit that should have left EVERYONE running for the door.
I don’t make this stuff up and, after putting about 10 hours non-stop into making this article what it is, I have nothing more to say other than:
- to encourage you to consider the evidence the extent to which sentiment plays a powerful role in the trading markets and
- that if there was a better precious metal setup than the one we presently have – I simply do not believe it.
Best always, John
(Editor’s Note: The author’s views and conclusions in the above article are unaltered and no personal comments have been included to maintain the integrity of the original post. Furthermore, the views, conclusions and any recommendations offered in this article are not to be construed as an endorsement of such by the editor.)
*http://thedailygold.com/gold-and-silver-sentiment-reversal-is-inevitable/ (John Townsend; [email protected]; Copyright © 2013 The Daily Gold)
Related Articles:
1. What Must Happen for Bull Market in Gold, Silver & PM Stocks to Resume?
Precious metals – Gold, Silver, Platinum, Palladium and there respective mining shares – have failed to sustain any rebound despite tremendously supportive sentiment amid an extreme oversold condition. Nevertheless, we believe that the bottom is in and a rebound should begin very soon. The question though is, “What will the driving force be for a sustainable rebound which will evolve into a new cyclical bull market?” Below are several options to be considered and my assessment as to which it will be – and why. Read More »
2. Gold & Silver: It Could Get Uglier! Here’s What the Charts Are Saying
The next chapter [in gold and silver] has yet to be written. One thing is likely to be certain, it will get uglier. The public will not be prepared for what could take a few more years to develop, and the potential for yet much lower prices for both gold and silver. Read More »
3. Gold Stocks Are a Compelling Buy – Here Are 3 Reasons Why
I believe the drivers for the yellow metal remain intact, however, so for investors who can tolerate the ups and downs, gold stocks are a compelling buy. Here are three reasons Read More »
4. What the Charts Say About the Future Price Action of Gold & Silver
The monthly silver chart does not reflect what could be viewed as ending action for the decline. If/as price rallies, it may be more of a futures selling opportunity than a sign of recovery. As the structure stands, odds favor lower price attempts. Read More »
5. Gold & Silver: Don’t Wait for the Bottom – “Average Down”. Here’s Why
You cannot control what others do, especially those in power. You can control what you do. Just keep buying, regardless of price, because if/when the price of gold and silver were to go lower, you may not be able to buy. If/when the price of gold and silver were to go higher, it may be at such an accelerated rate that any price in the past few years seem cheap. Words: 550 Read More »
6. Wait for Gold to Surpass $1,478 Before Going Back In – Here’s Why

Going forward, if gold can break $1,478, the next level of interest is the closing price of $1,501 from April 12. If you are looking to get long gold, it would probably be best to wait until the commodity can get back above at least one of these levels before making a commitment. Read More »
7. Gold: Wait for Signs of Stabilization Before Buying In – Here’s Why
We are seeing signs of a bottom…in gold…but… prudence calls for waiting for some signs of stabilization before getting long. I would rather miss the first 10-20% move than lose another 50% should I get long prematurely. [Let me show you some charts that illustrate my caution.] Words: 288; Charts: 6 Read More
Well Done John Townsend
Here are some of my thoughts:
I believe that the Central Banks (along with their Partners) are adding to their own PM holdings and they will continue to do so since they will be able to best take advantage of any reductions in the perceived value of PM’s LIKE THE LAST PLUNGE, which they help create by allowing naked shorting by their Partners who are allowed to use their paper currency as collateral for the naked shorting that is caused the big drop in the value of PM’s that scared many owners of PM’s into selling!
I believe that the Financial FIX is in, the Central Banks are now using this and other techniques for their own benefit and not the public’s the public’s (because ordinary investors are not allowed to do naked short trades) who have no control over those that control their money supply or its value.
Now despite the gaming of the PM markets, i.e. selling naked shorts which only the Ultra Wealthy leadership partners can do, most small investors still believe that in the long run, PM’s offer a level of confidence that paper money can never hope provide!
We are seeing a continued attack on PM prices but I predict that PM prices will not “plunge” from their current value, since those holding actual PM’s will not fall for the same trick by the Central Bankers and their Partners (of selling paper backed naked shorts) twice.
I believe that in the very near future, “Coin of the Realm” will no longer be considered paper money, especially since everyone knows that money does not grow on trees yet the very paper it is printed on is made from trees!
For me THE KEY INDICATOR is the backlog in actually taking possession of PM’s once they are paid for, the longer delay, the less any “paper” drop in the price of PM’s matters to those that want to hold for the future!