Over the last week, the market has been decimated…and decades of financial data suggest that further downside is entirely likely…anywhere from 10-30% is over the next year. Here’s why.
The above comments, and those below, have been edited by Lorimer Wilson, editor of munKNEE.com (Your Key to Making Money!) and the FREE Market Intelligence Report newsletter (see sample here – register here) for the sake of clarity ([ ]) and brevity (…) to provide a fast and easy read. The contents of this post have been excerpted from an article* by QuandaryFX originally posted on SeekingAlpha.com under the title Stay Calm And Sell, Sell, Sell! and which can be read in its unabridged format HERE. (This paragraph must be included in any article re-posting to avoid copyright infringement.)
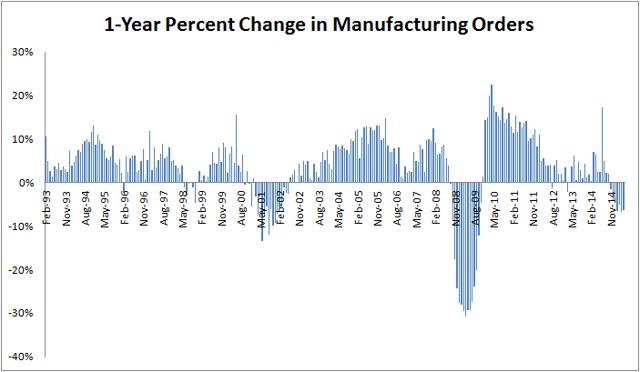
Manufacturing Is Slowing
As of July, manufacturing had slowed 6% year over year, indicating that the market was in for a downturn.
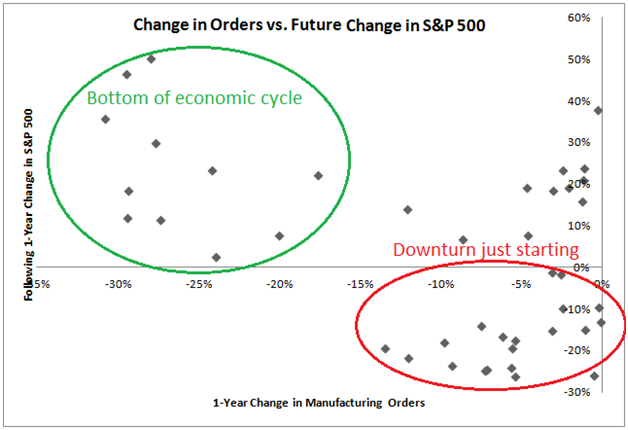
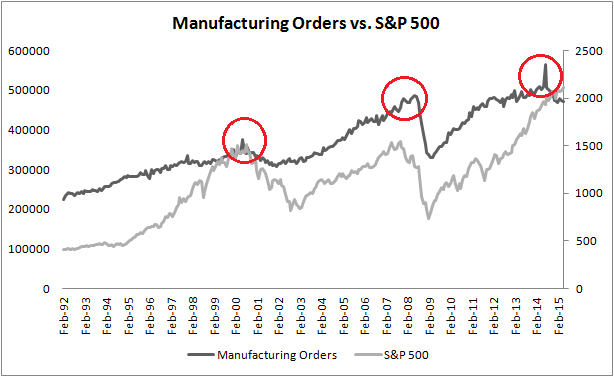
There Is A Direct Correlation Between Manufacturing Orders & Future Returns Of The S&P 500
As seen below, there is a very clear and strong relationship between changes in manufacturing orders and the future returns of the S&P 500. In other words, we can successfully forecast market movements using downturns in the economy. What is most significant about this relationship is what it is saying now – using the latest data, we are still in the early stages of an economic downturn, and if this downturn is anything like what history indicates, we may see a further downside of 5-25% in the global markets over the next year. This downturn has been clearly written on the charts.
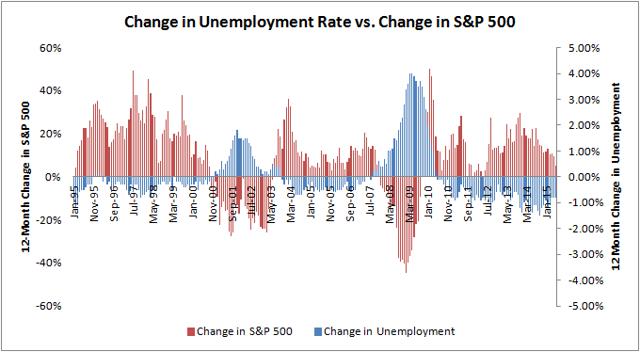
There Is A Direct Correlation Between Changes In Employment & Changes In The S&P 500.
…To be an investor that outperforms the crowd you must, by definition, invest differently than the crowd. For example, when the unemployment report shows that the U.S. economy is near peak employment, we need to critically examine market history to determine what happens to the stock market when employment is strong. A simple examination will show that there is a direct correlation between changes in employment and changes in the S&P 500. Knowing the existence of this relationship is pivotal. If you can predict the change in unemployment for a given time period, you can essentially predict the direction that the stock market will travel.
Unemployment To Rise
To predict unemployment, we must dig a little to find patterns in employment figures.
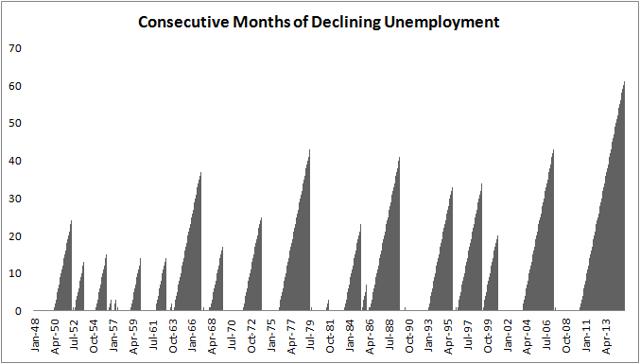
A metric I have found very useful is counting periods of improvement – the count of consecutive months in which employment has improved on a year-over-year basis for the past 64 years and, simply said, this is the best recovery that the U.S. economy has ever experienced. Things are rosy and the markets have increased for several years straight.
[Given the current] situation, however, your inner contrarian needs to activate, as there are two factors which will greatly impact unemployment in the very near future.
- The manufacturing industry cannot sustain a record drop in orders and jobs not be lost – it is simply impossible and
- the Federal Reserve is about to increase the discount rate. When the Federal Reserve increases rates, capital is squeezed and businesses must cut back – it is simply the reality.
The above two factors will push unemployment higher and, unfortunately for investors, when unemployment increases stocks decrease and, historically, the S&P 500 has fallen by anywhere from 5-50% over the next year following a sudden rise in unemployment.
Conclusion
The market has ruthlessly punished idle investors. The writing has been on the wall for several months but it is not too late for you to protect your capital.
*http://seekingalpha.com/article/3471396-stay-calm-and-sell-sell-sell?ifp=0
“Follow the munKNEE” via:
- Twitter: #munKNEE
- Facebook: @Facebook
- Market Intelligence Report newsletter (Sign up HERE; sample HERE)
Check them out. They make it easy to keep informed of what’s new on munKNEE.com.
Related Articles from the munKNEE Vault:
1. Reversion to the Mean of the S&P 500 Means A Further 33% Decline
Historically, the average P/E ratio of the S&P 500 is 16.64, and a reversion to said mean would represent a further decline in the index of 33%.
2. The Stock Market Crash Season Is Here – Here’s What the Future Holds
Where do we go from here? I can promise you, it’s only going to get worse! Like our economy, there is clear seasonality when it comes to stocks. Trends flesh out overtime. It’s not random. From that data, I want to give you a picture of what the next few months might look like.
3. Trying to Time the Market Is a Fool’s Errand – Here’s Proof
Pullbacks happen, and usually the market recovers, so trying to time the market is probably a fool’s errand – and a money loser.
4. Hang In There! Panic Selling Is A Failing Strategy – Here’s Proof
Successful investors outperform by being patient and riding out the volatility. Losers panic and sell at what might appear to be the beginning of downturns. Losers make the mistake of thinking they can predict what will happen next and unsuccessfully time the market. Here’s proof that Panic Selling Is A Failing Strategy.
5. Predicting What the Stock Market Will Do Is Impossible – Here’s More Proof
Predicting what the stock market will do in the next 12 months is tantamount to predicting coin flips. Here’s more proof that past stock market performance tells you nothing about future results — literally nothing.