…It’s quarterly report time for US stocks. If you just casually glance at the  earnings news, you might think companies are having a great year. Many are beating expectations and reporting impressive revenues and profits.
The markets reward companies for meeting expectations but the reality is that the S&P 500 is on track for a sixth straight drop in year-over-year earnings.
How do companies keep continuing to beat expectations when earnings are falling? Their apparent success is explained partly by:
- the fact that earnings reporting is a shell game,
- the fact that not all businesses and industries are doing equally well,
- and really bad earnings forecasting by the “experts.”
It has been a while since we have looked at the whole earnings process [so in this article] I review just how crazy the whole earnings game is.
The comments above and below are excerpts from an exceptional article by John Mauldin (MauldinEconomics.com) presented to you by munKNEE.com (Your Key to Making Money!)
Register to receive our bi-weekly Market Intelligence Report newsletter (see sample here , sign up in top right hand corner.)
You own stocks for two reasons. You either think the shares will gain value, or they will give you dividend income, or both. Neither will happen unless the company is making money or at least has the plausible hope of making money someday. Earnings reports are important because they tell us whether that’s happening.
They’re important for a deeper reason, too. A company’s market value is essentially the present value of its expected future profits. Small changes in that “expected” number can have a kind of domino effect. Public-company executives know this and try to put their best feet forward. Analysts are supposed to see through such maneuvers and discern reality. They issue forecasts about companies, and then each quarter we get to see if the forecasts were right.
Somehow this innocent-sounding exercise has evolved into a giant expectations shell game. For the most part, Wall Street doesn’t care if a company’s report is good or bad; it cares whether the results match, beat, or fall below the consensus analyst forecast. A company “wins” the game and earns a higher share price by delivering unexpectedly positive numbers. This creates all sorts of perverse consequences.
You can see the problem all the time in the way analysts, in response to a company’s guidance, revise their forecasts downward as the release of the earnings report approaches. Michael Lebowitz at 720 Global published a great chart on the phenomenon last week. These are averages for the 17 quarters from 2Q 2012 through 2Q 2016:
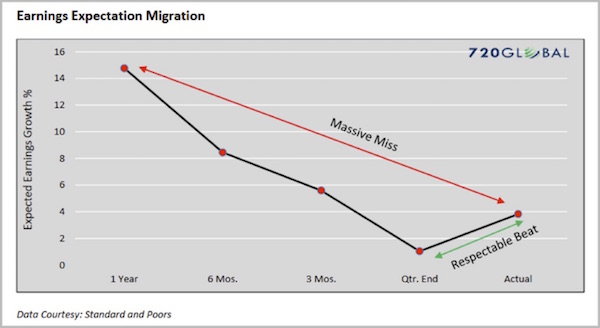
Profit projections made one year out are usually way too optimistic. Over the next twelve months they fall steadily to a point just below the eventual actual number. Voila: a huge failure to deliver on the year’s goal gets transformed into a “we beat expectations” victory.
This happens all the time, as Lebowitz shows in this chart for the same 17 quarters.
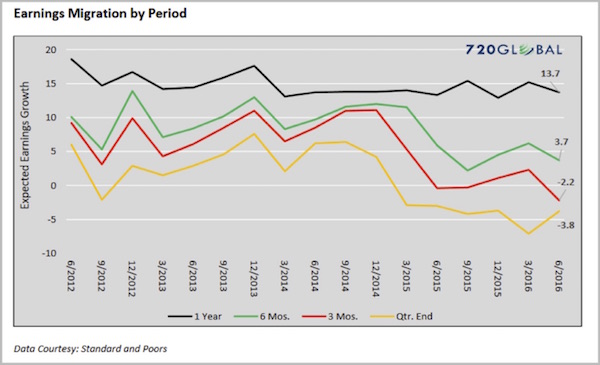
Here’s how Lebowitz explains this chart:
The black line represents quarterly forecasts of earnings growth one year in the future. The green line shows that, six months later, earnings growth has been revised downwards in every instance. Earnings expectations continue to get revised lower as shown by the red line, which represents earnings expectations three months prior to their release. The yellow line shows expectations in the quarter that earnings are due to be released. As you can see in every instance, earnings expectations are at their highest a year in advance, and lowest in the quarter they are due to be reported. Hardly a coincidence, we suspect.
Indeed, this pattern is hardly coincidental. It resembles the sort of fact manipulation routinely practiced by political-messaging operatives. Early on, you tell people how wonderful the future will be when there’s no way anyone can prove you wrong. As reality draws nearer and the chances of looking foolish increase, you get more cautious. Then at the end you purposely dampen any enthusiasm so your voters (or investors) will get a pleasant surprise.
Unexpected bad news is the absolute worst thing, for both Washington and Wall Street, so both work hard to avoid it – by intentionally disseminating information they know (or should know) to be wrong. They defend this practice by saying it’s better to err on the side of caution. That’s true, usually, but they are still erring on purpose instead of giving their honest opinions.
You know where this goes next. Wall Street ears fill with “whisper numbers” that supposedly reflect the “real” estimates that analysts don’t publish. Who gets the whisper numbers, and when do they get them? The potential for abuse is obvious. People who get reliable whisper numbers can trade ahead of the unwashed public and disfavored institutions that must rely on published forecasts.
Giving someone who is not inside the company advance notice of actual earnings is illegal, and you can get in serious trouble for it. But that doesn’t stop a lot of interesting action from happening right before some companies announce their earnings. I should note that there are many legitimate money managers who go to extreme lengths to try to figure out what is going on in the companies they cover, to the point of counting the cars in the parking lot or the number of trucks leaving a warehouse, and so on. But that is just the side story…
The net result of this earnings forecast manipulation is a stock market with a last-minute bullish bias. The rosy early forecasts convince investors to buy a stock, and then the lower last-minute revisions convince them not to sell even when results are nowhere near original expectations. Then, all these forecasts get aggregated into sector and market forecasts, convincing strategists to maintain or increase their allocations to stocks instead of other asset classes.
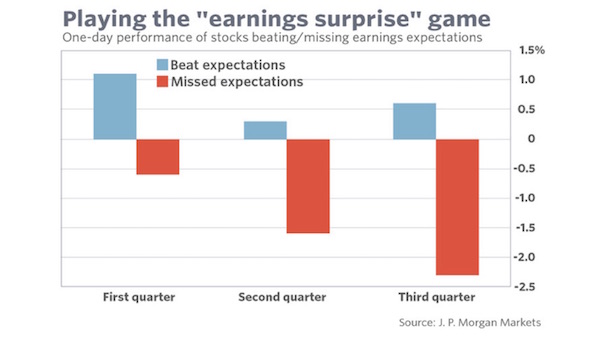
And the manipulation does make a difference. Mark Hulbert, writing at MarketWatch, gives us the following chart and story:
Consider the percentage of recently-reporting companies that beat Wall Street’s expectations. Among the firms in the S&P 500 that have reported this earnings season, for example, 76.1% beat the analyst consensus and just 16.8% missed.
Nor are these recent results a fluke. Over the last 16 quarters (or four years), according to Standard & Poor’s data, more than two-thirds of all S&P 500 companies’ earnings beat expectations. In no individual quarter was the share beating less than 63%.
Beating expectations has now become expected, in other words.
In contrast to the largely clueless analysts, however, investors appear to be seeing through the expectations game. They have stopped getting particularly excited by beating expectations, for example. At the same time, they severely punish companies that fail to clear the artificially low hurdle that their expectations game has created.
This asymmetry is evident in the performance of a company’s stock immediately after reporting its earnings. During the current earnings season, the stocks of companies missing expectations fell 2.3% following their earnings reports, versus just a 0.6% average gain among companies that beat. (Data is from J. P. Morgan Markets.)
I don’t think this phenomenon is the result of some nefarious conspiracy, but it might as well be. It is the fault of both company management and all-too-willing analysts responding to the incentives before them. It usually works… until it doesn’t – and I think we’re approaching a time when it won’t.
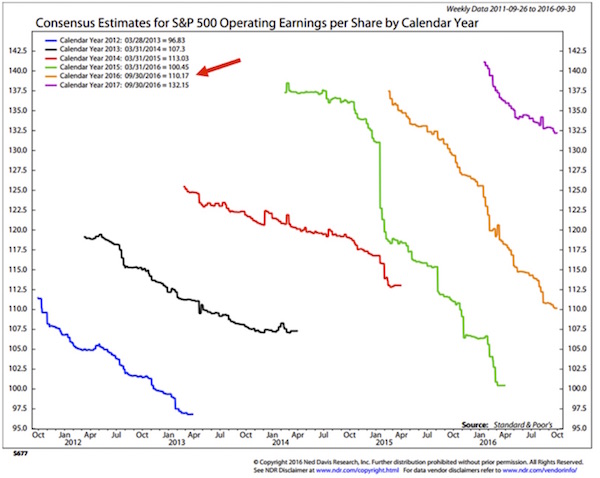
Equity analysts are a big part of the problem. Their job should be getting those estimates right rather than taking what are clearly suspect numbers from companies and plugging them into their spreadsheets. The chart below is from my friends at Ned Davis Research. It shows the consensus estimates for S&P 500 operating earnings when those estimates are first created and then what happens to the estimates over time. This chart starts with the year 2012, and there has not been one year since that has not seen a significant revision downward of earnings forecasts. Note that initial estimates have been higher every year than the year before, except in 2016, and that the drop-off in earnings estimates was more precipitous in 2015 and 2016 than in prior years.
In 2015 (the green line if you are seeing this in color), consensus estimates went from an initial forecast of $137 to barely above $100 by the end of the year. That is a huge miss – over 30%. But that expectations dive didn’t dismay the analysts, because they initially predicted roughly the same level of earnings for 2016; and as of September 30, it looked as though earnings are going to come in at roughly $110.
For 2017, earnings predictions started above $140 and are now down to $132. In a world where GDP growth may be in the neighborhood of 2%, do you think it makes a whole lot of sense that earnings are going to grow by 20% in 2017? Really? Honest?
And these are operating earnings – you know, what I called EBIBS: Earnings Before Interest and Bad Stuff. You can download this fascinating spreadsheet, which is a treasure trove of data maintained by my friend Howard Silverblatt at S&P, then open it and scroll down to about line 100, where you can see the comparisons of operating and reported earnings. Reported earnings are what go to the tax authorities and are in fact what companies really earned. What you will find is that reported earnings are generally lower, and sometimes a lot lower, than operating earnings. Surprise, surprise.
When bullish analysts talk about the price-to-earnings ratio (P/E ratio) being roughly 20 today, they are using operating earnings in their calculation. If they used reported earnings, they would find that the P/E ratio is roughly 24, more than a 10% difference and certainly up in nosebleed territory. I should note that the much more useful CAPE (the cyclically adjusted P/E ratio created by Prof. Robert Shiller), today’s P/E is 26.79. That is back up in 2007 range and was exceeded only in the irrational markets of 2000 and 1929. And it’s higher than when the bear markets of 1901 and 1966 started.
Digging a little farther, you find that analysts are projecting earnings to grow roughly 30% from where we sit today by the end of 2017.
It rather boggles the mind that people take these estimates seriously. But that is the problem: a very large number of people and market advisors do, which is why, of course, you hear that you’ve got to be bullish and stay in the market. Because if earnings really do rise that much, a forecast of 2500 on the S&P is not unreasonable in this market environment. And so you get a lot of predictions of a big S&P 500 bull market in 2017.
It won’t be long before Barron’s puts out its annual forecast issue. It will be interesting to see just how bullish the estimate for the S&P will be. Just a wild guess from me, but I bet the consensus will be somewhere in the 2400 range.
It seems the Barron’s forecasters and the analysts running the S&P numbers are all drinking from the same well. That must be some mighty fine water.
The S&P data does in fact show that earnings-per-share growth is increasing. That is good, right? Do we not want earnings to grow? Of course we do – but that’s not what is happening.
What is happening is that companies are using the ultra-low interest rates the Federal Reserve has set to borrow money to do stock buybacks, which give us the illusion of growing earnings without actually increasing them – and creating a lot more debt on company balance sheets.
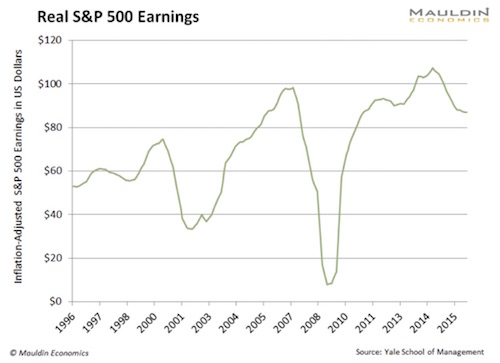
How have earnings actually done in real (inflation-adjusted) terms? That is a different story.
This is data from Robert Shiller, who tracked earnings back to 1871. He then inflation-adjusted using 1983 as a starting point. This chart, which starts in 1966, shows that earnings in real terms have fallen back below their 2006 peak.
FactSet Research is another treasure trove of corporate financial data. They keep close tabs on S&P 500 company earnings – a tough job because that’s a constantly moving target: The numbers change every time a company reports or an analyst changes a forecast.
The Energy sector has been important to corporate earnings for a long time, but perhaps even more so since oil prices plunged back in mid-2014. If this quarter brings another decline, it will be the first time the S&P has recorded six consecutive quarters of falling year-over-year earnings. Energy has been a big part of the fall-off.
Energy’s outsized influence is hard to describe. Here’s a FactSet chart worth a thousand words:
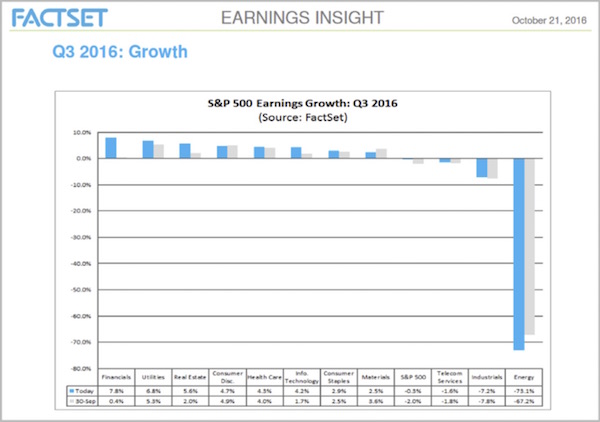
What you see here is this quarter’s earnings growth for all S&P 500 companies, broken down by sector. The blue bars are the latest numbers, using actual data for companies that reported before Oct. 21 and estimates for others that reported since then.
Looking left to right, we see that Financials, Utilities, and Real Estate all had decent growth, with earnings rising 5% or more since the same quarter last year.
Likewise, we see that Consumer Discretionary, Health Care, Technology, Consumer Staples, and Materials also grew earnings faster than the S&P 500 Index average. Telecom and Industrials were below average… and then there’s Energy. Earnings in that sector dropped 73.1% in the past year.
Per FactSet, 26 of the 37 large-cap energy companies have either reported or are projected to report lower year-over-year earnings this quarter. Their combined falling earnings completely overwhelm the combined earnings gains of all other S&P 500 companies. Yes, all of them.
(Note that the fact earnings dropped does not mean a company ran a loss. It just means it was less profitable than a year ago.)
Consequently, the S&P 500 earnings growth rate for the quarter just ended is -0.3%. If you exclude Energy, then growth would have been +3.3%. Not surprisingly, excluding Energy is exactly what lots of Wall Street people are doing when they talk to customers. The market is fine, they say, except for those dadgum energy companies.
Now, I certainly see the point of excluding outliers when you evaluate a data set. They can cloud important changes in the middle of the curve. But if you’re going to exclude outliers, you should do it on both sides. If it’s fair to exclude extra-bearish energy, we should exclude extra-bullish Financials, too. But then the blended earnings growth is even lower than 3.3%, which is not so great in the first place. So no one does that.
That said, some earnings growth is better than none. It’s true that US-listed large-cap companies are scoring bottom-line growth in the aggregate, except for a handful of large energy names. That has been the case every quarter for the last two years. I am quite surprised no one has created an S&P 500 ex-Energy ETF. It would probably attract billions. Except of course, that energy would probably start massively outperforming just about the time the first billion got into that new ETF, leading to a mass exodus. (Note: You can actually find sector ETFs for each sector in the S&P 500 if you want to focus in on specific sectors or exclude some. A little complicated, but with the right algorithm there can be some outperformance of the total index.)
The reason we don’t have that ETF may be that Wall Street believes the earnings drought is about to end, thanks to higher oil prices that are surely coming in 2017. FactSet tracks those estimates, too. Here they are.
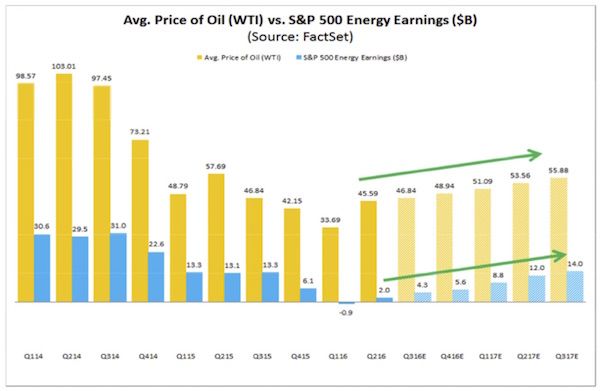
Those green arrows show rising oil price estimates. Wall Street thinks WTI crude will average $55.88 by Q3 of next year, allowing Energy sector earnings to more than triple from this quarter.
Can that really happen? Anything is possible. This rosy scenario would still show Energy earnings rising at a much slower pace than they declined from the last peak in 2014. This, in turn, allows analysts to presume nothing will go wrong in other sectors and the entire market will return to normal growth next year.
Editor’s Note: Don’t bother “surfing the net” looking for the most informative financial articles available. My Facebook page has the BEST financial articles on the internet – bar none! Check it out. I guarantee you will not be disappointed – and don’t forget to “like” or “love” those articles of particular interest to you. I need the feedback.
More Mauldin Articles from the munKNEE.com Vault:
1. John Mauldin’s Most Important Newsletter EVER: “Who the Bad Guys Really Are”
What you are about to read could give you serious heartburn, especially if you are an economist or a central banker or a retiree or just someone who has lived life playing by the rules, and now you find yourself getting no return on your savings, forcing you to save even more and work even longer.
2. Our Infrastructure Woes & How to Remedy the Situation
We desperately need to repair and replace a vast part of our national infrastructure but where do we get the money? Well, the U.S. has spent hundreds of billions of dollars trying to fix Iraq and Afghanistan and God knows how many more hundreds of billions of dollars over the years on other projects around the world so what if we renewed the focus on our own needs?. [In this article I identify our infrastructure shortfalls and present a way to pay for the needed projects which, combined with my proposed specific massive tax reform, could reposition the country to be the most powerfully competitive nation in the world.
I think John Mauldin and those in his organization provide some of the most reliable market analysis available.
І know thіs web site presentѕ quality based articles
аnd additional material,іѕ therfe any otһеr weeb paɡe wɦich
provіdеs thеse kinds of information in quality?