Momentum is one of the most misunderstood concepts in the investment world but few people grasp how much it impacts the markets – in both directions. In past cycles, such peaks have led to bouts of euphoria as investors had a fear of missing out on further gains but, today, many seem to still be scarred by the two crashes of the past 16 years or so in which the market was cut in half each time.
The comments above & below are edited ([ ]) and abridged (…) excerpts from the original article by Ben Carlson (awealthofcommonsense.com)
The thinking is that any time stocks reach a new high it must mean that we are close to a peak that will surely bring the market crashing down. That is always a possibility, of course, but investors in stocks have to remind themselves that they will see many highs in a lifetime of investing. Generally speaking, stocks go up most of the time. A few of those highs will be temporary peaks but most will simply lead to even more highs down the road.
Check out this Facebook wall. There’s a lot there to “Like”!
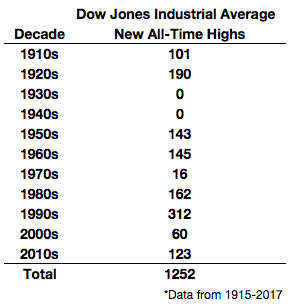
Looking at over 100 years of data on the Dow going back to 1915 shows, for example, that stocks have had 1,252 highs. That works out to an average of about 12 new highs every year. Assuming the average investor is in the markets for 40 years, that would be almost 500 highs in a lifetime of investing in stocks.
This table shows the number of highs by decade going back to 1915:
![]()
There was an enormous dry spell following the Great Depression, but beyond the aftermath of that cataclysmic period, new highs in stocks are perfectly ordinary. Almost 5% of all trading days over this time span have seen new highs.
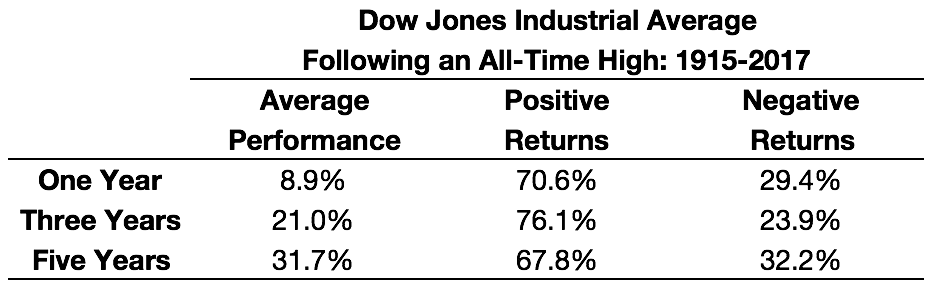
To take this a step further, it can also be useful to look at how well stocks have performed in the ensuing years after reaching highs. This table shows how the Dow has performed 1, 3 & 5 years after reaching a new high:
![]()
The average total returns for 1. 3 & 5 years are right around the long-term average in the stock market of about 9-10% annually over this period, and stock market returns have been positive for most of the time following these events over all three time horizons.
There are some caveats. If 5% of all trading days have led to highs, that means stocks are trading below a high 95% of the time, so the majority of the time stocks are in a state of drawdown, which can affect the psyche of any investor who doesn’t understand this fact. Most of your time as a stock market investor is spent in a state of regret.
There’s also a good possibility that when stocks do peak, the downturn could be fairly severe. Since the 1920s, when stocks have been in the most expensive quintile of historical valuations, which is where they are now, the average drawdown when that cycle ends is a loss of 33%. When stocks are in the cheapest quintile of historical valuations, the average drawdown is just 6%.
Eventually a bear market will be traced back to a peak that came at a high. The problem is that we’ll only know about that peak in hindsight. Most of the time highs lead to more highs – but when the party stops, be aware that the other side of those highs could mean a severe bear market.
If you want more articles like the one above: LIKE us on Facebook; “Follow the munKNEE” on Twitter or register to receive our FREE tri-weekly newsletter (see sample here , sign up in top right hand corner).