Earnings may be a consideration when investing in the stock market, but whether you make money or not depends on the extent of monetary inflation. The rate of inflation has been twice that of the gains seen in the Dow Jones since 1920 but currently, while Wall Street may be seeing a “bull market”, the inflation adjusted returns investors receive from rising share prices aren’t compensating them for the decline in purchasing power the dollars their profits are denominated in. [Let me explain further.]
The above introductory comments are edited excerpts from an article* by Mark J Lundeen as posted on gold-eagle.com under the title Monetary Inflation And The Stock Market.
Lundeen goes on to say in further edited excerpts:
- Economic growth,
- compelling value,
- rising earnings,
- skilled management and
- monetary inflation flowing through the Federal Reserve
all have had an important part in driving share prices higher over the decades but, while I wouldn’t dismiss the importance of the first 4 aforementioned factors when considering where to invest money in the stock market, the one factor that has impacted share prices more than any other is usually ignored:
- monetary inflation flowing from the Federal Reserve.
Below is a chart plotting U.S. Currency in Circulation (CinC) since 1920 [please forgive the spelling of circulation in the chart].
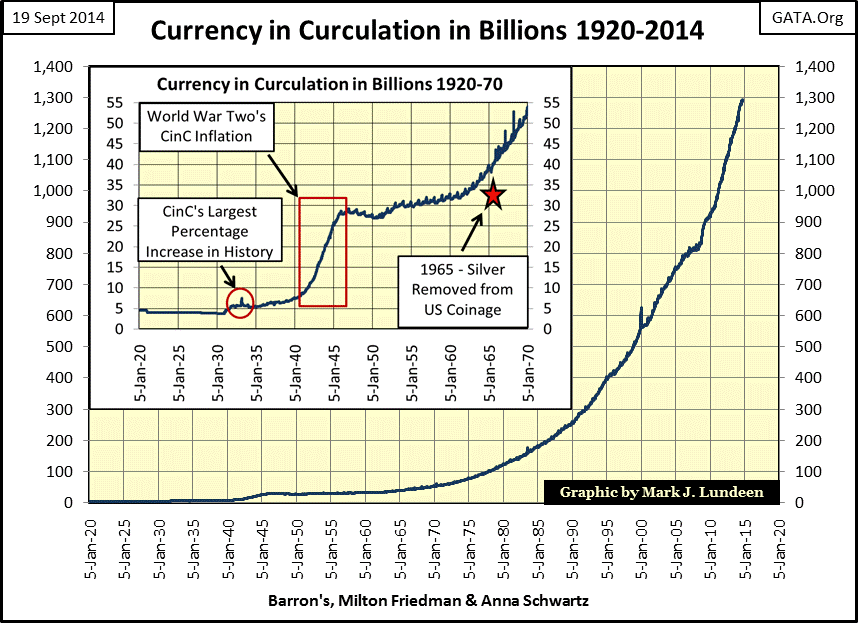
- CinC’s largest percentage increase in history occurred in 1931 (Red Circle) during the Great Depression when President Hoover attempted to stop deflating asset valuations by printing money. It’s not particularly evident from the little spike in the chart above, but will be better illustrated in the next chart.
- The Second World War years (Red Rectangle) were very inflationary.
- Though CinC in 1965 wasn’t much larger than in the late 1940s, the U.S. Government decided to removed silver from U.S. coinage (Red Star).
I believe the primary reason silver was demonetized (removed from U.S. coinage) was the intention of Washington’s political establishment to expand CinC, as seen in the chart above.
The chart below plots the number of paper dollars per [troy] ounce of US gold. The U.S. suffered from double digit CPI inflation in the 1970s and early 80s because of what you see below.
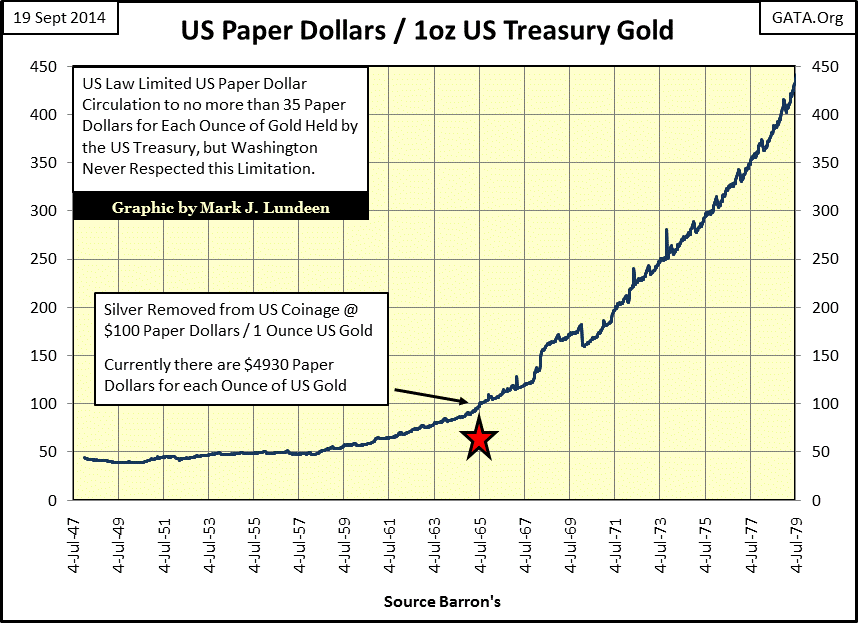
With a monetary system pegging gold at $35 a [troy] ounce, but with a banking system allowed to create many times more than $35 paper dollars for each [troy] ounce of monetary gold, it’s not hard understanding why a run on the U.S. gold reserves developed or why President Nixon closed the Treasury’s gold window in August 1971.
For another perspective on the CinC data plotted two charts above, let’s examine CinC’s year over year percentage change (weekly basis) in the chart below.
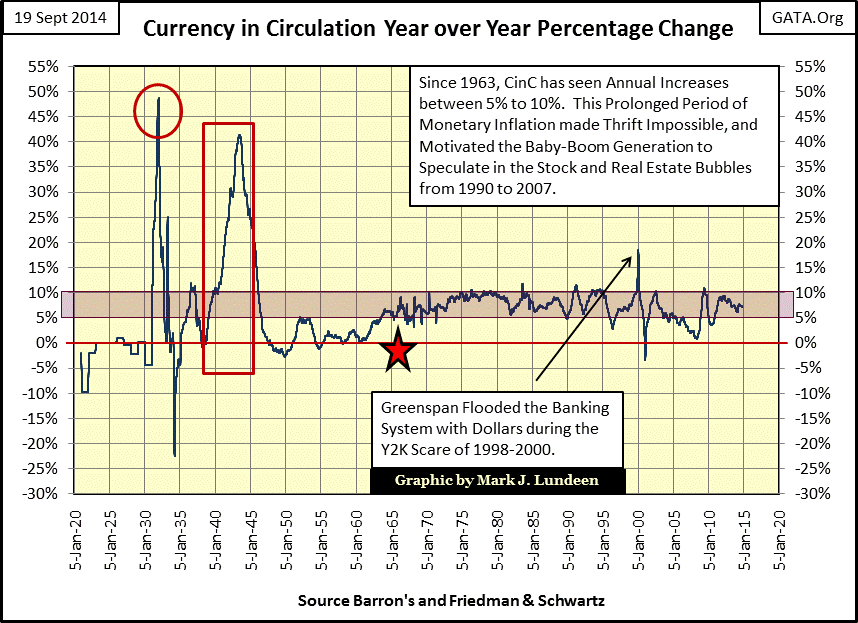
From 1920 to 1931 (during the gold standard) CinC was mostly unchanged as paper money 90 years ago was fully exchangeable with gold coin. Anyone could take a $20 bill to a bank and exchange it for a $20 double-eagle gold coin minted by the U.S. government. By law, the Federal government didn’t print any more paper dollars than the U.S. Treasury had minted gold coins to back them.
However, after 1931 President Hoover (and everyone else) were driven to desperation by the Great Depression. Washington’s political and financial establishment expanded the supply of paper money by 49% to stop the pain. Unfortunately, it didn’t work. The “policy makers” of the 1930s, then as now, refused to understand that their deflationary problems were only the predictable consequence of their past inflationary debauchery in credit and currency creation.
The simple fact was that thanks to the newly created Federal Reserve System, for the first time, banks of the 1920s were able to extend credit (bank loans) directly to consumers – and they did! The term “buy now pay later” was coined by the Singer Sewing Machine Company during the Roaring 20s, thanks to bank credit created by the Federal Reserve. The dollars created by bank loans (if not by increases in CinC) financed an unnatural demand in the economy that pulled up the price of everything from shares trading on the NYSE (via margin debt) to real estate (via mortgages).
Just as had occurred during the subprime crisis of 2007-09, when overextended debtors of the late 1920s began defaulting on their debt to banks, deflation took hold of the economy during the 1930s but this only occurred because the banking system made it a policy to extend credit to people for things they couldn’t afford.
- By March 1933 (Red Circle above) the ability of banks to create credit was so impaired that Washington was finally forced to create monetary inflation the old fashioned way; they began printing paper dollars in a vain effort to slay the dragon of deflation.
- The second largest surge in CinC occurred during World-War Two (Red Rectangle above).
- The most interesting inflationary event in this chart occurred in the summer of 1965 when silver was removed from US coinage (Red Star above).
During the Great Depression and all through World-War Two, the rate of increase of paper money creation was unpredictable and sporadic but by the post war era (1946-63) it’s apparent that Washington was taking care not to inflate the supply of paper dollars at a rate of more than 5% a year, and usually much less than that.
- In 1945 Washington ratified the Bretton Woods Monetary Accords, officially pegging gold at $35 paper dollars to one ounce of gold.
- However, since the removal of silver from U.S. coinage in July 1965, the annual increase in CinC to this day has seldom fallen below 5%; $35 gold and $1.29 silver soon became distant memories, and that’s no coincidence.
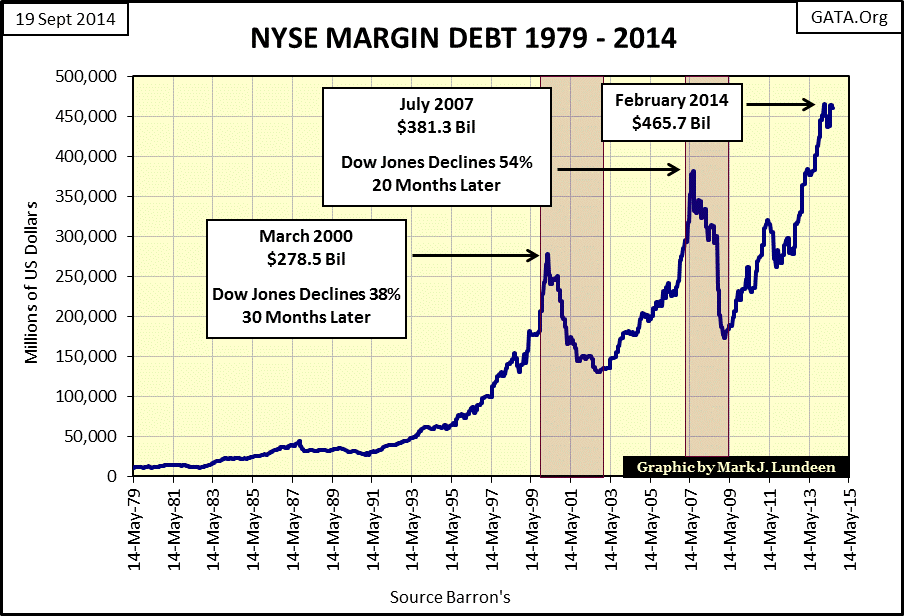
The following two charts illustrate the correlation between the creation of bank credit (NYSE Margin Debt) and the valuation of the Dow Jones.
During the Roaring 1920s’ bull market, speculators leveraged their capital gains by 800% (10% margin) with borrowed money from the banking system (created by the banks through fractional reserve lending, not from inflating CinC). Unfortunately, that meant that during the Great-Depression Crash these same speculators leveraged their capital losses by 800% as well, forcing many banks to fail as the financial system deleveraged in a collapsing stock market.

Though stock market speculators today are only allowed 50% margin, credit inflation and deflation have continued to be a major influence on Wall Street’s bull and bear market cycles since 1979. The red boxes below highlight the high-tech and sub-prime mortgage Dow Jones bear markets.
Currently NYSE margin debt is again at record levels (its third peak in the past fourteen years). IF we’re on a seven-year market cycle, we are due for another contraction in NYSE margin debt and another major bear mauling of the stock market.
Something that isn’t widely known is CinC’s relationship with Dow Jones’ earnings. Note that these plots in the chart below are * NOT * indexed, but charted as published. With varying degrees of success, since 1929 for every billion dollars in CinC (Red Plot) the Dow Jones amazingly strives to produce a dollar in earnings (Blue Plot).
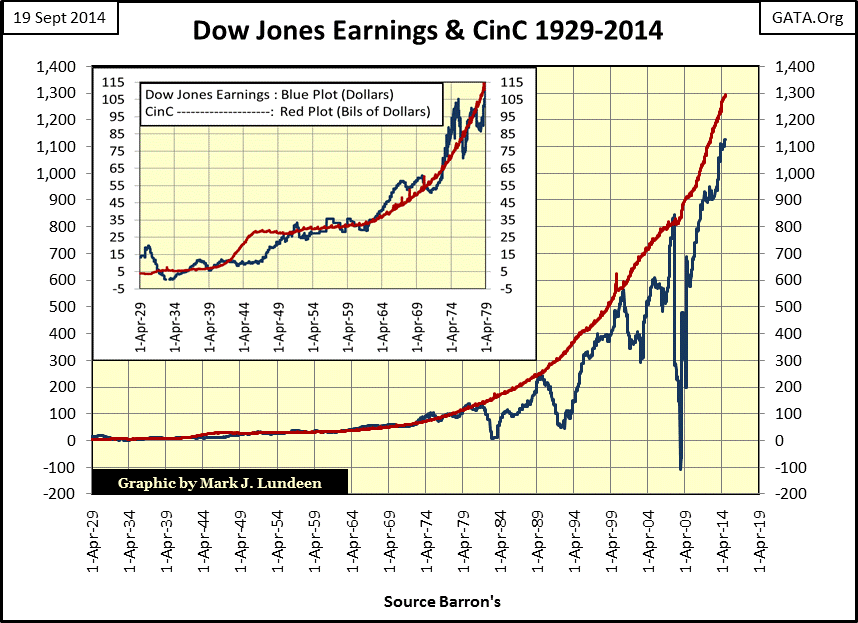
From 1926 to 1979, as seen in the chart’s insert above:
- the Dow’s earnings closely tracked the increase in monetary inflation for fifty years, occasionally exceeding it.
Since 1979:
- the growth in Dow Jones earnings has had difficulty keeping up with the rate of inflation created by the Federal Reserve.
- Every time the Dow’s earnings (Blue Plot) caught up with the increase in CinC inflation (Red Plot), Dow Jones earnings collapsed.
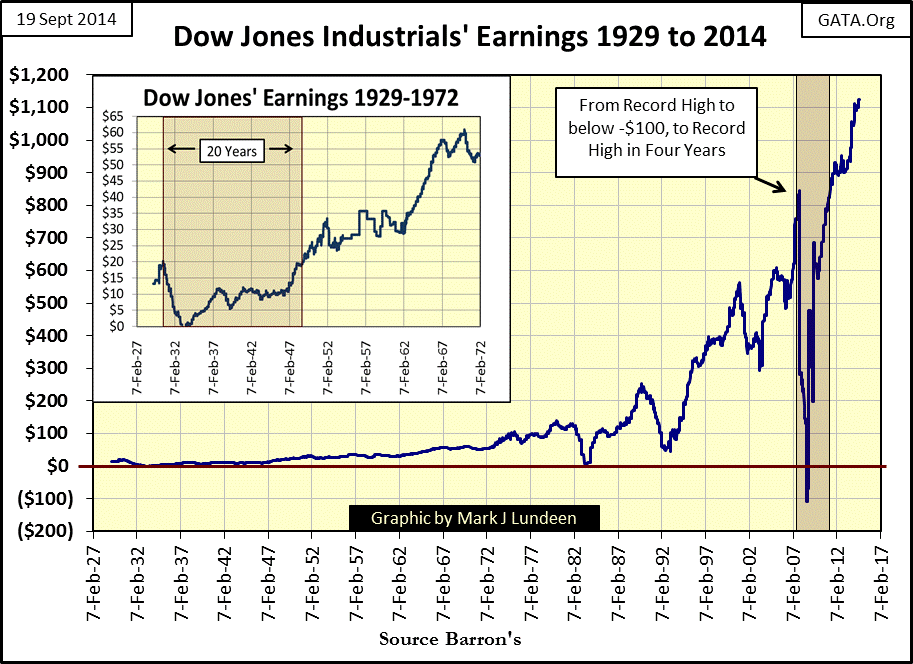
The current advance in earnings is amazing! The Dow Jones saw a ten month / $900 free fall in its earnings during the 2007-09 credit crisis. In fact, for only the second time since 1929, Dow Jones earnings went negative in 2008. The first time the Dow’s earnings went negative was in 1932 at the bottom of the Great Depression bear market.
As seen in the chart below, there was one major difference between the Dow Jones earnings collapses of 1932 & 2008. After the Dow Jones’ earnings went negative in 1932, it took twenty years before its earnings returned to their highs of July 1930. Compare that to the Dow Jones earnings recovery from the sub-prime mortgage crash; it took only four years to fully recover its losses.
Returning to the chart above where Dow Jones earnings are plotted with CinC, it becomes obvious why there is such a significant difference in the time required for earnings recovery; monetary inflation is far greater today than in the 1930s & 40s.
Earnings may be a consideration when investing in the stock market, but whether you make money or not depends on changing share prices so exactly how does monetary inflation impact the price of the Dow Jones? Well, as we see below the rate of inflation has been twice that of the gains seen in the Dow Jones since 1920. Currently Wall Street may be seeing a “bull market”, but the inflation adjusted returns investors receive from rising share prices aren’t compensating them for the decline in purchasing power the dollars their profits are denominated in.

Below is another view of the data plotted above; the Dow Jones valued in constant 1920 dollars.

It’s fair saying that since 1920, the only Dow Jones bull market that actually proved profitable to the average retail investor was the Roaring 1920s bull market, if they sold before the bottom fell out from under them, and without a doubt, since 1929 each major surge in the Dow Jones has benefited less from rising CinC (monetary inflation).
Conclusion
The numbers flashing for the Dow Jones on CNBC are impressive, closing Friday at 18,014 but, when valued in constant 1920 dollars, the Dow Jones ended the week at just above $60; an 86% decline from its highs of 1929 in the chart above.
Is the above really an accurate assessment of the stock market’s performance of the past century?
Maybe not, but after commissions, income tax and, yes, the depreciating dollars the Dow Jones is valued in, the rising Dow Jones isn’t doing as much good for investors as the “experts” would have investors believe but, then, the people who control the Federal Reserve System don’t inflate the money supply for our benefit, but for theirs!
Editor’s Note: The author’s views and conclusions in the above article are unaltered and no personal comments have been included to maintain the integrity of the original post. Furthermore, the views, conclusions and any recommendations offered in this article are not to be construed as an endorsement of such by the editor.
*http://www.gold-eagle.com/article/monetary-inflation-and-stock-market
If you liked this article then “Follow the munKNEE” & get each new post via
- Our Newsletter (sample here)
- Twitter (#munknee)


