…[T]here is a consensus in the investment markets today believing that student debt is a major credit problem rivaling other credit problems that were disastrous over the last 30 years… This [article] seeks to explain the lies, damned lies and the statistics surrounding the student debt myth in the United States.
The above introductory comments are edited excerpts from an article* by Cole Smead, CFA, (smeadcap.com) entitled The Myth of Student Debt: Lies, Damned Lies and Statistics.
A second aspect of the anguish surrounding student debt actually has very little to do with the debt, but, instead, reflects the frustration over the economy and a lack of wage growth during the last decade. The chart below shows that, despite student debt increasing from 2001 to 2010, mean wage income has dropped since 2001, a legitimate frustration to be sure.
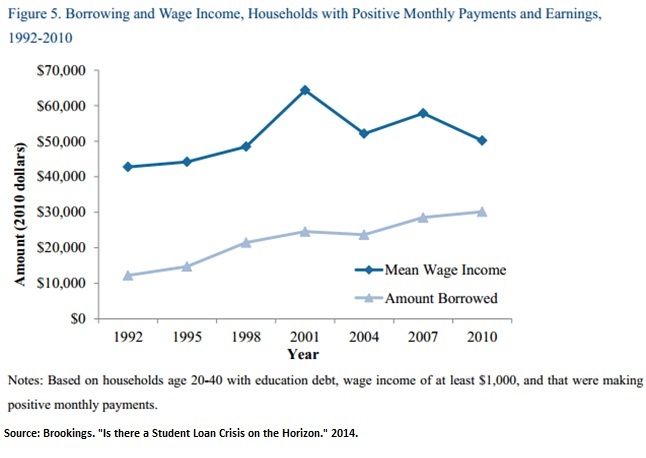
We can sum up the frustration like this: if we are creating more debt in the name of education, there should be a corresponding growth in the wages of America. Wage growth has been a missing benefit that understandably frustrates citizens and politicians alike. This doesn’t point to an easily identified problem, but possibly a cyclical or unique circumstance.
[This video from BusinessInsider.com (Produced by Sara Silverstein and Alex Kuzoian) entitled Here’s What’s Truly Frightening About The Student Debt Bubble claims that “Student debt looks exactly like mortgage debt before the housing crisis but the fallout will be much different.” Check it out!]Damned Lies
In an effort to address the anguish and outcry of rising debt, the long silent player, the federal government, has taken a prominent and active role in the student debt market. On the back of the Affordable Care Act, a little talked about provision provided the federal government the ability to take over the federally-funded student loan programs. This provision no longer allows private companies to provide federally-subsidized lending to the student loan marketplace. It’s clear to us that the government now views these loans as a public good and thus would best be administrated by someone not seeking a profit; loans have moved from privilege to entitlement.
Below is a chart showing the growth of federal loans since 2002. The rapid increase began in 2008 when the government takeover took place.
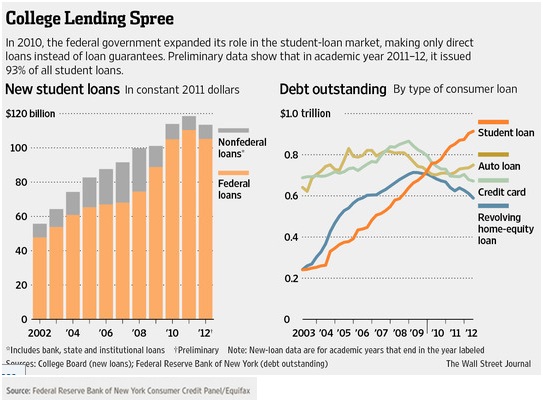
The data shows that the federal government is en route to doubling the amount of capital being thrown at the “educating the future of America.” In our view, the political rhetoric and government goals for student lending have not matched up with what is economically valuable.
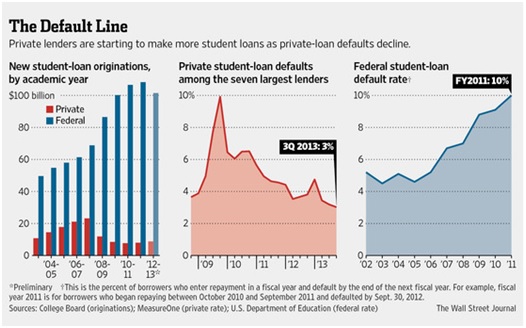
According to the Department of Education, the current default rate on loans for students who have been out of school for at least two years is 10%. This is the highest default rate since 1995, indicating that this is the worst underwriting of federal student loans in almost 20 years.
Below,
- the chart to the far right depicts the climb in default rates among federal student loans in recent years
- the chart in the center highlights the default rates in private student debt among the seven largest lenders. These private lenders are experiencing 3% default rates versus the federal government’s 10%.
It looks to us like the government’s ability and willingness to provide capital to the marketplace is increasingly uneconomic and misallocated. Friedman might say that in student lending, they’ve run out of sand.
Statistics
Despite the big-picture and alarming charts above, three problems with student loans are far more distant.
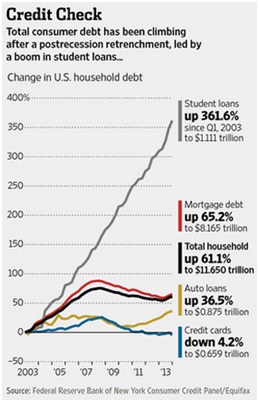
- The $1 trillion outstanding student debt number is so big to the average person’s mind that it immediately leads to fear. This is very analogous to people fearing the levels of household debt today, which is high. Both of these pictures only look at the balance sheet side of the situation and not the income statement…
- The household debt service ratio levels are the lowest since 1980, when the Federal Reserve began recording the data.
- Correspondingly, student debt service ratios are historically normal and/or depressed as depicted by the chart below from a recent Brookings Institute Report.
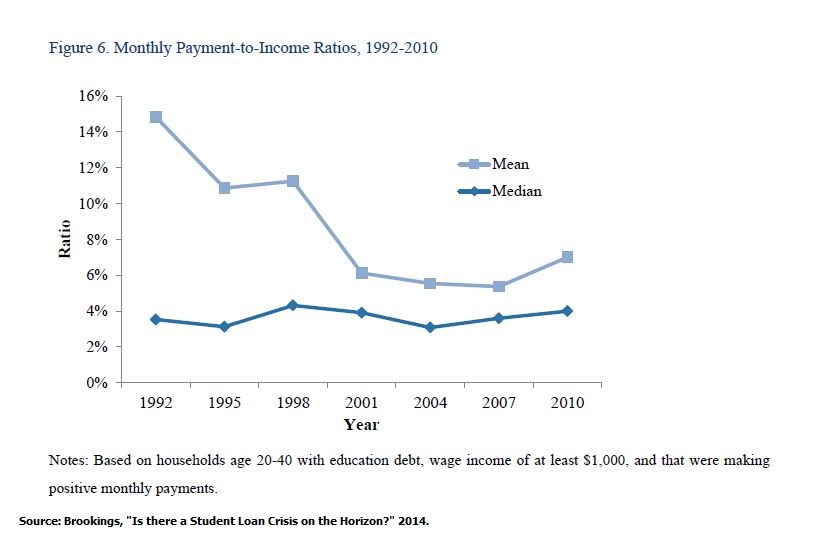
The data shows there have been large improvements in the payment of debt compared to other historical periods on average. It was worse to be a student in a graduate program during the 1990s, despite lower average amounts of debt compared to today. The data clearly shows how intelligent the consumer has been on this subject. They are financing one of the best self-improvement vehicles in life at one of the best times to do it.
Stupid? No. Brilliant? Yes.
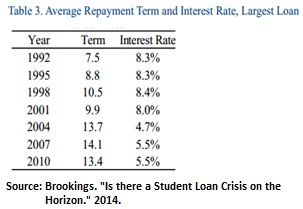
The table to the right shows interest rates that have been paid for student debt since 1992. Once again, further evidence that the consumer of student debt is being opportune, unlike the brilliant pessimists in the market would have you believe.
The big demystifying revelation about student debt comes from the snapshot of how much student debt is actually held by households between 20 to 40 years old. Numerous articles over the last three years have capitalized on our fear by making everyone believe there are huge pools of students with an excess of $50,000 in debt. Below are articles from major publications over the last three years that showcase households in more than $80,000 of student debt.
“A Generation Hobbled by the Soaring Cost of College,” New York Times. May 12, 2012.
“Millennials’ ball-and-chain: Student loan debt,” USA Today. July 1, 2013
“Banks Take Interest in College Lending,” The Wall Street Journal. Feb 24, 2014.
The chart below debunks this myth:

As of 2010, 76% of households have less than $20,000 of debt, with most of that camp having less than $10,000 in debt. We are not dealing with major problems for the average student or household.
The numbers have been skewed by outliers in the pie chart. Graduate programs and extremely expensive private colleges appear to have created the skew or fat tail for our stat-junky friends out there. The skew makes the averages look far larger than the economically realistic median.
Taking on $10,000 to $20,000 of student debt to make an average of $25,000 per year in added salary over the next 20 years looks compelling from our end of the economic view. When you add the lowest interest rates in years, it looks even more compelling…
Editor’s Note: The author’s views and conclusions in the above article are unaltered and no personal comments have been included to maintain the integrity of the original post. Furthermore, the views, conclusions and any recommendations offered in this article are not to be construed as an endorsement of such by the editor.
*http://smeadcap.com/smead-strategies/smead-blog/entries/2014/09/17/the-myth-of-student-debt-lies-damn-lies-and-statistics/ (© Copyright 2014. Smead Capital Management. All rights reserved.)
If you liked this article then “Follow the munKNEE” & get each new post via
- Our Newsletter (sample here)
- Twitter (#munknee)
Related Articles:
1. Student Loans: the Situation; the Problems; the Solution
Data from Barclays Research clearly shows that the strain on US consumers from student loans isn’t going to improve any time soon and that the risk to the taxpayers is on the rise. Read More »
2. The Surprising Side Effects of Rising College Costs
The rising cost of college tuition translates into many students re-evaluating higher education, their future professional careers as well as other major life decisions. Find out more in our very enlightening infographic on The Surprising Side Effects of Rising College Costs. Read More »
3. Excessive Growth In U.S. Credit Card Debt Is Unsustainable – Here’s Why
Over the past three months, the year-over-year growth in credit card debt has exceeded wage growth in the United States. This is the first time we’ve seen this trend since the Great Recession. Read More »
4. The High Cost of Education and How to Reduce It
With college costs consistently outpacing the rate of inflation, many students are thinking twice when it comes to going to college. Let’s explore the numbers students are up against today and how to make higher education more affordable. Read More »
5. Americans Take Note! A College Education Is HALF the Cost in These English-speaking Countries
Americans take note! A first class college education in other English speaking countries can be had for half the average cost of one in the U.S.. This infographic tells you where and how much you would pay. Take a look. Read More »
6. Resurgence of Subprime Auto Debt Spells T-R-O-U-B-L-E
During the credit crisis, one of the problems that occurred was that too many loans were being made to people that had no ability of paying their debt back. We see this trend in full stride once again in the auto industry. Subprime auto lending is back in a big way. Why is this happening? What are its repercussions? This article explains. Read More »
7. These Degrees Are the Ticket to the 10 Top Paying Careers
Staying in school has always been seen as the way to get ahead. Post-secondary education, especially a university degree, is often the ticket to the big pay cheque but not all degrees are created equally when it comes to earning potential. Which programs lead to the best paying jobs? Check out our list of the top earning degrees. Words: 775 Read More »
8. American Grads: Here’s a Great Guide to Personal Finance
Graduating from college can be an exciting and stressful time. Suddenly you need to find a job, replay loans and make solid financial decisions. Fortunately, you don’t need to be unprepared. Below are some budgeting basics to keep your spending under control, some suggestions on how to set financial goals and a list of the top 10 American cities for starting out. Read More »
9. Which U.S. Universities & Fields of Study Generate the Highest ROI?
Recent research by PayScale has revealed that the average ROI for U.S. university graduates (693 schools surveyed) is $387,501 over a 30-year period. 6 of the universities generated a return on investment for its graduates in excess of $1.6 million. Read More »
10. Grads in Higher Demand Than Last Year – Here’s What Employers Want
While the economy can certainly make job hunting frustrating for some recent grads, it’s not all bad news. 59.3% of employers surveyed rated the current job market good to excellent, and 9.5% plan on increasing their number of hires this year. Learn more from the infographic below. Read More »
A recent survey by the National Association of Colleges and Employers has revealed that the majority of paid interns receive a job offer and the majority who accept such offers (the majority) stay with their new employer for more than 5 years. Conclusion: internships are a “win-win” for students and employers alike. Read More »