Wall Street’s proclivity to create serial equity bubbles off the back of  cheap credit has once again set up the middle class for disaster. The warning signs of this next correction have now clearly manifested, but are being skillfully obfuscated and trivialized by financial institutions.
Nevertheless, here are 10 salient warning signs that astute investors should heed as we roll into 2016.
By: Michael Pento
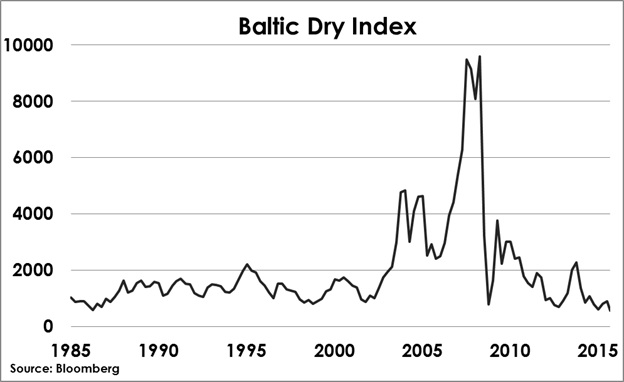
1. The Baltic Dry Index, a measure of shipping rates and a barometer for worldwide commodity demand, recently fell to its lowest level since 1985. This index clearly portrays the dramatic decrease in global trade and forebodes a worldwide recession.
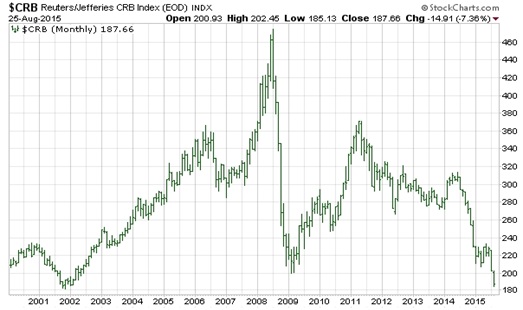
2. ..The CRB index, which measures nineteen commodities, after a modest recovery in 2011, has now dropped below the 2009 level—which was the nadir of the Great Recession.
3. Nominal GDP growth for the third quarter of 2015 was just 2.7%. The problem is Ms. Yellen wants to begin raising rates at a time when nominal GDP is signaling deflation and recession. The last time the Fed began a rate hike cycle was in the second quarter of 2004. Back then nominal GDP was a robust 6.6%. Furthermore, the last several times the Fed began to raise interest rates nominal GDP ranged between 5%-7%.
‘Follow the munKNEE” via newsletter (3x weekly) – sample here – sign up in top right corner
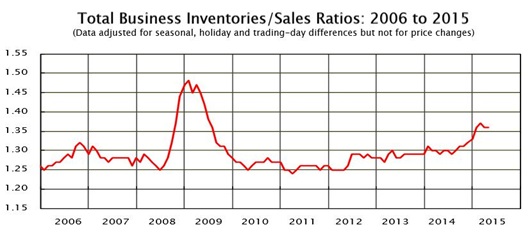
4. The Total Business Inventories to Sales Ratio shows an ominous overhang: sales are declining as inventories are increasing. This has been the hallmark of every previous recession.
5. The Treasury Yield curve, which measures the spread between 2 and 10 Year Notes, is narrowing. Recently, the 10-year benchmark Treasury bond saw its yield falling to a three-week low, while the yield on the Two-year note pushed up to a five-year high. This is happening because the short end of the curve is anticipating the Fed’s December hike, while the long end is concerned about slow growth and deflation.
Banks, which borrow on the short end of the curve and lend on the long end, are less incentivized to make loans when this spread narrows. This chokes off money supply growth and causes a recession.
6. S&P500 Non-GAAP earnings for the third quarter were down 1%, and on a GAAP basis earnings plummeted 14%. It is clear that companies are desperate to please Wall Street and are becoming more aggressive in their classification of non-recurring items to make their numbers look better. The main point is why pay 19 times earnings on the S&P500 when earnings growth is negative–especially when those earnings appear to be aggressively manipulated by share buy backs and through inappropriate charges.
“Follow the munKNEE” on Twitter
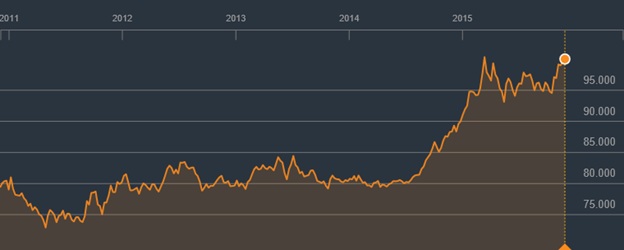
7. The rising US dollar is hurting the revenue and earnings of multi-national companies. Until recently, multinational companies have enjoyed a slow and steadily declining dollar from its mid-1980’s Plaza Accord highs. This decline boosted the translated earnings of multi-national companies. As the dollar index breaks above 100 on the DXY, multinational companies, which are already struggling to make earnings from a slowing global economy, are going to have to grapple with the effects of an even more unfavorable currency translation. In the long-term, a rising US dollar is great for America. However, it in the short-term it will not only negatively affect S&P 500 earnings, but also place extreme duress on the over $9 trillion worth of debt borrowed by non-financial companies outside of the U.S.A.
Bloomberg DXY: Dollar Index
8. ..The US is currently in a manufacturing recession:
- The November ISM Manufacturing Index entered into contraction for the first time in 36 months posting a reading of 48.6. This is a decline from the anemic October reading of 50.1 and marked the fifth straight month this index was in decline.
- The Chicago purchasing manager’s index (PMI) came in at 48.7 for November signaling contraction.
- The latest Dallas Fed Manufacturing Business Index fell to -4.9, from -12.7 in the preceding month.
- The Empire State Manufacturing Survey came in at -10.7, a fractional increase from last month’s -11.6, signaling a decline in activity and registering close to the lowest levels since 2009.
- The November Richmond Fed Manufacturing Index dropped 2 points to -3 from last month’s -1.
9. Credit Spreads are widening as investors flee corporate debt for the safety of Treasuries. The TED spread, the difference between Three-month interest rates on Eurodollar loans and on Three-month T-bills, has been on a steady rise since October of 2013; at the end of September it was at its widest since August of 2012 at the height of the European debt crisis.
“Follow the munKNEE” on Facebook
10. The S&P500 is at the second highest valuation in its history:
- The Cyclically Adjusted Price-Earnings (CAPE) ratio, was 26.19 in November. A value greater than 25 indicates that the stock market is overpriced in comparison to its earnings history. The CAPE ratio has averaged 17 going back to 1881.
- The Q RATIO, the total price of the market divided by the replacement cost of all its companies, historically averages around .68, but is now hovering around 1.04.
- The P/E RATIO of the S&P 500 is around 19 – above the long-term historic average of 15.
- Total Market Cap to GDP ratio is 122, ten percentage points above the 2007 level and eighty percentage points higher than it was in 1980.
- The Price to Sales Ratio for the S&P is 1.82. That is higher than 2007, when it was 1.52 and is at the highest since the end of 2000.
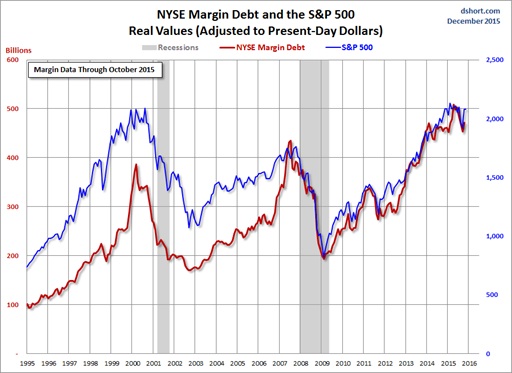
- And finally, Advisors Perspectives chart of inflation-adjusted NYSE Margin Debt and the S&P 500 demonstrates the profoundly over-leveraged condition of the market. Margin debt in real terms is now 20% greater than it was at the peak of the dotcom bubble!
If those ten warning signs weren’t enough to rattle investors then this should.
- The Fed is threatening to do something highly unusual; to begin a rate hiking cycle when the global economy is on the brink of recession… Investors should forget about the “one and done” rate hike scenario. The truth is the Fed will be very slowly tightening monetary policy until the fragile US economy officially rolls over into a contractionary phase and the meaningless U3 unemployment rate begins to move higher.
- This current economic expansion is now 78 months old, making it one of the longest in U.S. history.
- There have been 6 recessions since the modern fiat currency era began in 1971. The average of those has brought the S&P500 down a whopping 36.5%.
- Given that this imminent recession will begin with the stock market flirting with all-time highs, the next stock market crash should be closer to the 2001 and 2008 debacles that saw the major averages cut in half.
The original article was written by Michael Pento (pentoport.com) and is presented here by the editorial team of munKNEE.com (Your Key to Making Money!) and the FREE Market Intelligence Report newsletter (see sample here – sign up in top right corner) in a slightly edited ([ ]) and abridged (…) format to provide a fast and easy read.]
Want more such articles? Just “follow the munKNEE” on Twitter; visit our Facebook page and “like” an article; or subscribe to our free newsletter – see sample here.
Related Articles from the munKNEE Vault:
1. Get Ready: Stock Market Crash Coming in 3-6 Months – Here’s Why
The deteriorating junk bond market, along with rising credit spreads, is indicating that we will have a stock market correction in about 3-6 months. Here are the details.
2. If You Own Stocks Then This Article Is a MUST Read
Don’t be one of the people who don’t understand the vital importance of the bond market and what it’s telling you right now. This knowledge could help you avoid a huge hit to your net worth over the next 12-24 months. Here’s why.
3. US Dollar Rally Will Signal A Stock Market Crash – Here’s Why
The global carry trade (meaning money borrowed in US Dollars and invested in other assets) stands at over $9 TRILLION (larger than the economy of France and Brazil combined) but, given the U.S. dollar rally combined with the Fed’s hint at raising rates in December, it is at risk of blowing up. Here’s why.
4. This Ratio Is An Ugly Warning Sign For the Stock Market
Historically, the performance of the S&P 500 Index relative to the U.S. Dollar Index has been a good indicator of bull and bear markets but it has underperformed the Dollar Index since mid-2014. It’s an ugly warning sign for the market. I see the stock market moving downward from here.
5. What Do Wall Street’s Pros Forecast For S&P 500 In 2016?
Wall Street’s stock market gurus are still looking pretty bullish as many continue to forecast double-digit gains over the next year.