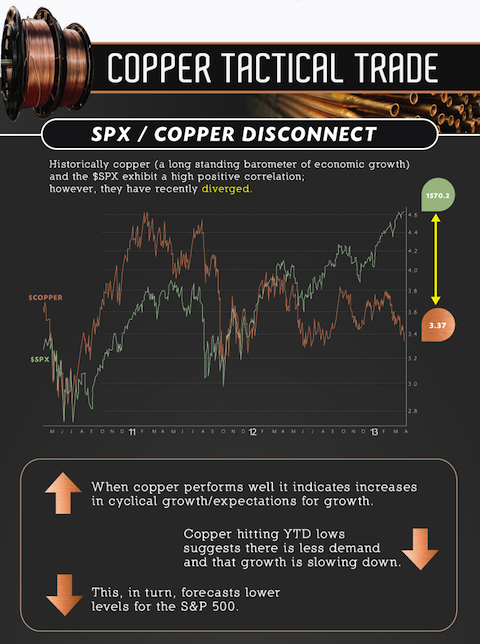
Dr. Copper, as it is affectionately known, has been a longstanding barometer of  economic growth and historically has shown a high positive correlation to the S&P 500. However, over the past several quarters there has been an increasingly large disconnect between the performance of major indices and the price of copper. With copper hitting YTD lows it suggests that there is less demand and that growth is slowing down and this, in turn, forecasts lower levels for the S&P 500. Words: 420
So says an introduction to an infographic/article* by www.VisualCapitalist.com as posted initially on seekingalpha.com under the title Trading Copper And The S&P 500 Disconnect.
This post is presented compliments of Lorimer Wilson, editor of www.munKNEE.com (Your Key to Making Money!), www.FinancialArticleSummariesToday.com (A site for sore eyes and inquisitive minds) and the free Intelligence Report newsletter (see sample here – register here). The post may have been edited ([ ]), abridged (…) and/or reformatted (some sub-titles and bold/italics emphases) for the sake of clarity and brevity to ensure a fast and easy read. You can also “Follow the munKNEE” daily posts via Twitter or Facebook. Please note that this paragraph must be included in any article re-posting to avoid copyright infringement.
The post is as follows:
Below is a 3 year chart of the SPX and copper [Go HERE for the latest copper prices].
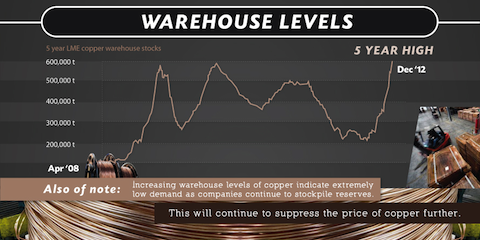
5 year LME warehouse supply levels have rocketed to highs in a matter of months, which illustrates a slowing demand on a macroeconomic basis at current prices.
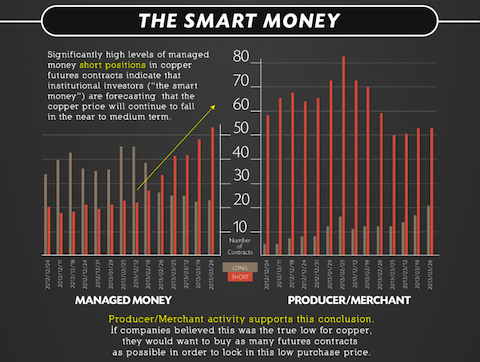
To further demonstrate the bearishness in the copper sector we point to the CME CFTC reports to indicate high levels of managed money short positions and low accumulation levels of futures contracts by the producer/merchants.
Copper miners and producers, as well as precious metals miners and producers, currently face adverse economic conditions in the form of higher production costs and tougher financing requirements. On a YTD basis, the COPX has outperformed when compared to the GDX and SIL. On a 3 year weekly chart the next support for the COPX is 9% away at $10.00.
For those that believe the housing market has bottomed, we would look to the manufacturers of copper products such as Encore Wire (WIRE) instead of the miners of the metal such as Southern Copper (SCCO) and Freeport McMoRan Copper & Gold (FCX). The miners are a cyclical play and there is no reason to believe in initiating a purchase other than to be underwater in the position for the short to medium term.
Copper has been trading in a range of higher lows and lower highs for roughly 5 quarters; this wedge formation (see graphic below) has a mid-point of 3.60. One can draw a smaller wedge that shows a technical break of 3.50 to the downside with an initial target of $3.00. Covering the position between the October 2011 low ($3.00) and June 2010 low (2.72) nets a return of roughly 15%.
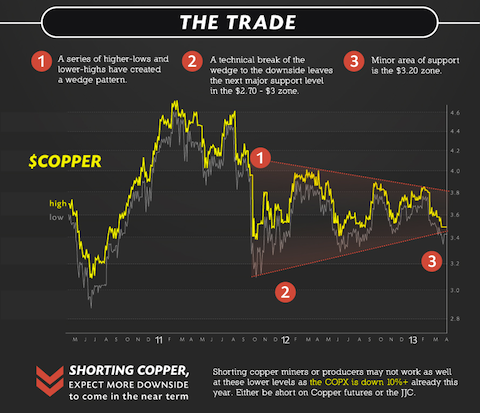
Bottom line: Copper is an industrial metal that is an excellent indicator of the current macroeconomic climate. We highlight the low demand via LME warehouse levels and high levels of managed money short positions in addition to the technical setup to provide an entry to forecast that copper prices will proceed lower over the short to medium term. Use copper futures or the ETF.
*http://seekingalpha.com/article/1330151-trading-copper-and-the-s-p-500-disconnect (This work is licensed under a Creative Commons Attribution-NoDerivs 3.0 Unported License. Copyright 2012 © Visual Capitalist.)
Other Visual Capitalist Infographics:
1. Copper: The Nervous System of Our Society – Here’s Why
Copper is one of the most widely used metals on the planet, and has been for more than 10,000 years. Today, it’s the nervous system of our society – of our cities, homes, tools and toys. The simple truth is that the western lifestyle is completely dependent on copper. Here’s why as depicted in the infographic below.
2. Gold: Why It Makes the Ideal Alternative Pricing Mechanism – An Infographic

Measuring market data using fiat currencies can be misleading. Even though an asset may rise in dollars, it may be because of declining currency value rather than true economic process. With central banks devaluing currency at record rates, gold’s steady purchasing power makes it an ideal alternative pricing mechanism.
3. Part 1: An Infographic on the History of Gold and What Makes It So Great

 Wars have been fought over gold, love has been expressed by it an gold has changed the landscape of civilizations and the world – but what makes gold so great? This infographic examines the history of gold from ancient history to the gold rushes of the centuries ago. It looks at its properties and how it became not only a currency, but the gold standard.
4. Part 2: An Infographic on Gold Mining & Supply

 From ancient times to the famous gold rushes, gold was first discovered in placer deposits….Today, however, most gold comes from hard rock deposits where gold is disseminated or associated with other metals and mined either through open pit or underground mining. This infographic tells (shows) you everything you need to know about gold mining and its supply from around the world.
5. Part 3: China’s Role in the Future of Gold
In this infographic we look at how gold growth in China will impact the future of the precious metal. In Q4 of 2011 and continuing into 2012, China has bought more gold overall than even India and will continue to play an important role in consumption.
6. Part 4: Why Is There Such An Interest In Gold?

< p>< p>< p>< noscript>
< p>< p>< p>< noscript>
< p>< p>< p>< noscript>
< p>< p>< p>< noscript>
< p>< p>< p>< noscript>
< p>< p>< p>< noscript>Is gold a commodity or currency? How does it behave as an investment? What are the fundamentals of investing in gold? What are the different ways investors can get exposure to gold in their portfolios? The answers to these questions and many others are answered in this latest infographic from Visual Capitalist.
7. Part 1: The History of Silver As a Currency – and More

 Silver has thousands of industrial uses and is considered a store of wealth by investors. The infographic below illustrates silver’s history as a currency in the past and as an essential component in industry and technology
8. The Silver Series (Part 2): Supply & Demand

 Of the 1040.6 million troy oz of silver produced in 2011, 84% was used in over 10,000 modern industrial applications (16% used as an investment) of which approx. 33% was used in the traditional forms of fabrication such as jewelry, coins, medals, and silverware with the remaining 66% actually being consumed. While the actual amount is unknown, some experts believe as much as 90-95% of all the silver ever mined has been ‘lost’ to landfills. For this reason, there is likely less silver available above ground than gold (98% of all gold is accounted for today). For more interesting information regarding the supply of, and demand for, silver please refer to the infographic below.
9. The Silver Series: Silver as an Investment (Part 3)
Silver has had double digit gains in 7 of the last 10 years. In this infographic, we look at the investment properties of silver as well as its chief differences with gold. Highlights include a study on silver correlation, volatility, performance against the US Dollar and money supply, and portfolio diversification.
10. Exploration for Minerals “to boldly go where no man has gone before” – Here’s Where

With growing global demand and declining mine grades commodity prices continue to rise. As such the exploration for minerals is taking on both new heights and new depths. This infographic outlines 5 of the most far-reaching and interesting ways of exploring for mineral wealth.
11. Nickel: Demand Strong, Supply Diversified & Prices Stable

 While best known for its use in the five cent coin, nickel has far more strategic uses. Nickel can be alloyed with other metals to create truly extraordinary materials – such as stainless steel which now accounts for more than half of all nickel consumed. China’s stainless steel consumption has increased 1625% in the last 10 years and is now the largest demand driver for nickel worldwide accounting for 40% of global totals. There’s still a lot more room for growth in the industry and nickel’s diversified supply is expected to keep prices stable, so the savvy investor should look for low cost nickel projects in safe jurisdictions. Check out the infographic below for more insights.
12. China’s Demand for Iron Ore (Steel) Continues – Here are the Facts

 Iron ore is now the world’s second largest commodity market after oil and is essential for developing nations to build infrastructure and to modernize accounting for 95% of all metal produced annually. [As I can personally attest to from my recent 29 day trip throughout mainland China, it is no surprise that] China’s rapid industrialization in the last decade…is responsible for all the growth in steel consumption since 2000…placing a huge strain on the global iron supply and pushing iron exploration into untapped regions of the world. Although the price of iron price rose steadily until peaking in 2011 (it has softened as of late), the long-term outlook is strong. Learn more in this informative infographic.
13. 2012 Ranking of Global Gold Mines & Deposits
How many ounces of in-situ gold exist? How many gold mines exist in Canada and elsewhere? How rare is a 1.0 million ounce undeveloped deposit? This report answers these questions and more while providing insight into the scarcity of mines & deposits.
14. Nevada: The Next American Gold Rush

Nevada has been a prolific mining region in the U.S. since the famous Comstock silver discovery in the late 1800s. It is now gold, however, that draws miners to Nevada. Learn more about how Nevada has become the next American gold rush in the infographic below.
15. Manganese Oxide & Electric Vehicles: The Next Great Power Couple
Manganese is the 4th most traded metal in the world, mainly because it is indispensable in the production in steel and other alloys. The fastest growing sector, however, is in the use of manganese oxides for use in batteries and particularly rechargeable lithium ion (lithiated manganese dioxide or LMD) batteries. LMD batteries are ideal for applications that require high levels of power all at once such as power tools and now electic and hybrid vehicles. Take a look at the infographic presented here to learn about the important role manganese will play in our future.
16. Graphite: The Driving Force Behind Green Technology

Global consumption of natural graphite has doubled in the last 10 years and will increase even more so in the next decade due to a) the continuing modernization of China, India and other emerging economies given the strong demand from traditional end uses such as the steel and automotive industries and b) the advent of new applications for graphite such as lithium-ion batteries, fuel cells, and nuclear and solar power. As a result of such increased demand prices for large flake, high purity graphite (+80 mesh, 94-97%C) have more than doubled making the mining of such a minerals increasingly profitable. Learn even more by viewing the infographic below.
17. It’s Time to Replace the Refrain “Got Gold?” With “How Much Graphite Stock Do You Own?”

Demand for lithium-ion (li-ion) batteries over the next 8 years – for use in electric and hybrid cars, smart power grids and mobile consumer devices – is going parabolic. Sales of electic/hybrid cars, for example, will be increasing 5-fold to 4,000,000 over that timeframe and every such car will have 30-110kg of graphite in their batteries, depending on the car, that can not be replaced economically. Forget the common refrain “Got gold?” A more appropriate refrain should be “How much graphite stock do you own?” Learn more about graphite in the infographic below.
18. Graphene Could Have a DRAMATIC Impact on Our Future – Here’s Why

Tens of billions of dollars per year are being spent worldwide on graphene research. Why? Because graphene could have a dramatic impact on our future by changing the fields of computing, energy, materials and optics. How? By making everything smaller, stronger and more ecologically sustainable. Below is an infographic that provides all the details.
19. Vanadium: An Infrastructure Essential With Major Potential Use in Energy Storage and Green Energy

This infographic looks at the primary uses for vanadium, its supply and demand, and future applications that could potentially affect the metal’s demand.
20. Tungsten Supply Risk Could Have Negative Impact on Cost of Living – Here’s Why

Tungsten is unique in its extremes. It’s extremely hard, heat resistant, dense, and environmentally benign. It’s used to make cemented carbide, one of the strongest and most durable compounds. That’s the positives. but, unfortunately there are negatives too. Take a look at the infographic below for more information.
21. Mining of Heavy Rare Earth Elements (HREE) in Canada by 2017 Offer Major Investment Opportunity

95-97% of the supply of Rare Earth Elements (REE) – integral to the high-technology, nanotechnology, hybrid automotive, aerospace and defence industries – currently comes from China. China has continued to reduce its export quotas to the point where it will only be supplying 50% of the world’s needs by 2015. This will have a major impact on prices for each of the 17 Light (LREE) and Heavy (HREE) elements that comprise the category – and the products in which they are used – unless alternate sources of supply are found. A Canadian company has done just that and will be bringing one of the largest HREE resources in the world (44% HREE, 56% LREE) into production by 2017. Below is an infographic on the REE market and a link to a Proactive One 2One Investor Forum presentation I attended on REE market fundamentals and the development and prospects of Quest Rare Minerals Ltd. and their Strange Lake project.