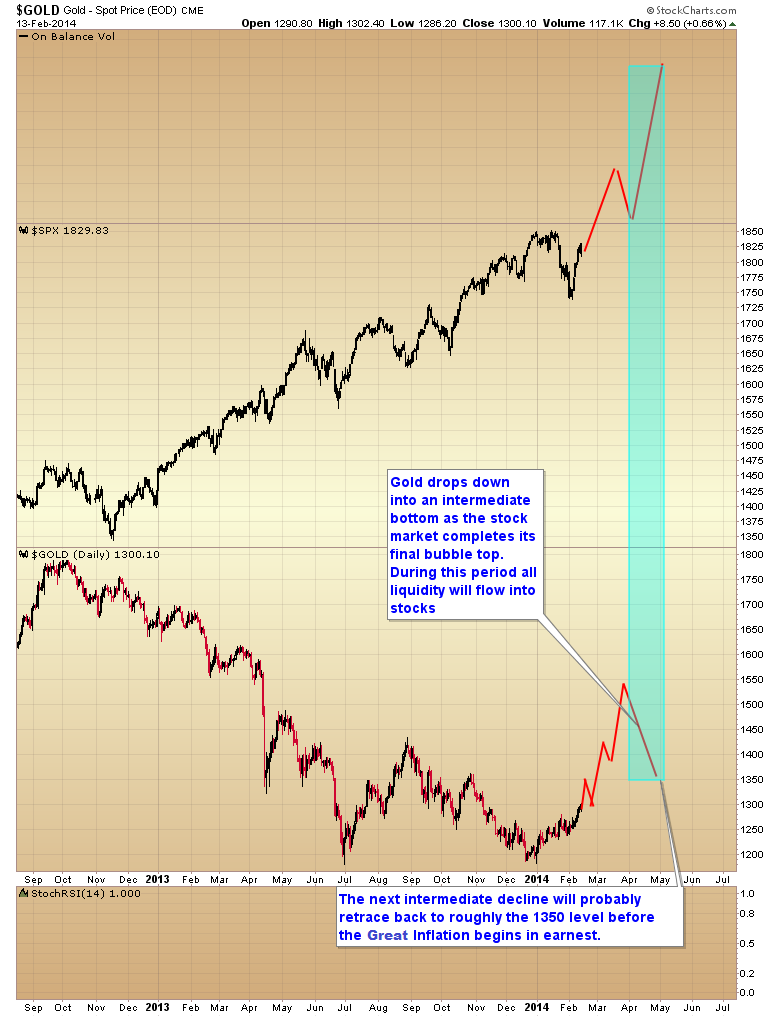
Over the next couple of months everything should generally rise together but once the dollar puts in an  intermediate bottom sometime in March or April, commodities and gold will move down into an intermediate correction as the stock market completes its final blow off top. After the stock market parabola collapses later this summer it will be time to put the pedal to the metal in the commodity markets, and especially the precious metal markets as the Great Inflation begins in earnest.
So says “Toby Connor” (goldscents.blogspot.ca) in edited excerpts from his original article* entitled ANOTHER PIECE OF THE PUZZLE FALLS INTO PLACE .
[The following is presented by Lorimer Wilson, editor of www.munKNEE.com and may have been edited ([ ]), abridged (…) and/or reformatted (some sub-titles and bold/italics emphases) for the sake of clarity and brevity to ensure a fast and easy read. This paragraph must be included in any article re-posting to avoid copyright infringement.]
Last week Connor mentioned in an article on this site entitled Stock Market Will Collapse In May Followed By Major Spike in Gold & Silver Prices! Here’s Why that:
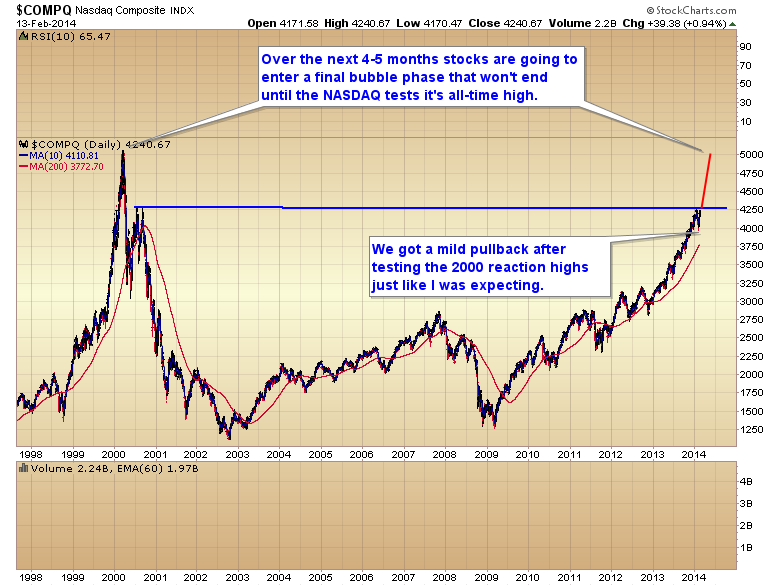
- the NASDAQ will reach all-time highs above 5000 before this cyclical bull market comes to an end in May or early June
- followed by a massive inflationary spike in commodity prices – particularly gold & silver.
This week Connor has gone on record that he expects:
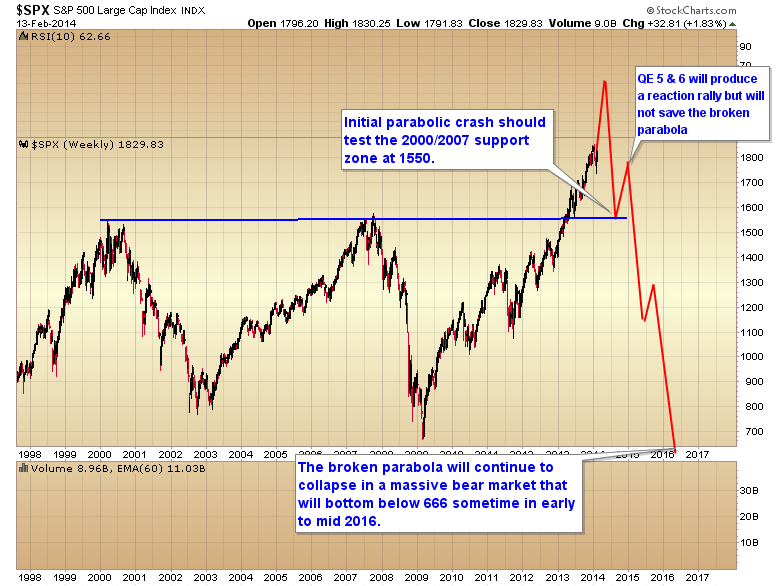
- the S&P 500 will crash at least back to the 2000/2007 support zone at 1550,
- Yellen will panic, reverse the taper, and probably initiate QE5 & 6,
- the broken parabola will not be reflated but it will trigger a reaction rally and then
- the S&P will continue to collapse into a massive bear market that will bottom below 666 sometime in early to mid-2016.
-
QE 5 & 6 to be the final nail in the coffin for the dollar, and trigger a full break of the megaphone top and move below the 2011 and 2008 bottoms before the dollar completes its final three year cycle low.

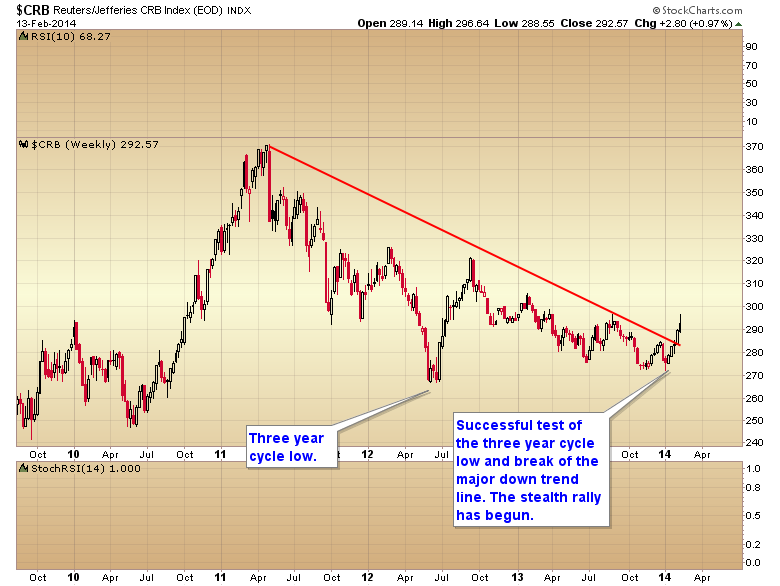
- commodity markets to continue a stealth rally having successfully tested the 2012 three year cycle low and have now broken through the multiyear downtrend line.
- gold to test the initial April breakdown at 1520 over the next 1-2 months.
- gold sentiment levels to be pushed to bullish extremes from their current depressed levels, triggering an intermediate degree profit taking event into May or June.
- silver sentiment levels to be pushed to levels next week that require the metals to pull back and take a breather.
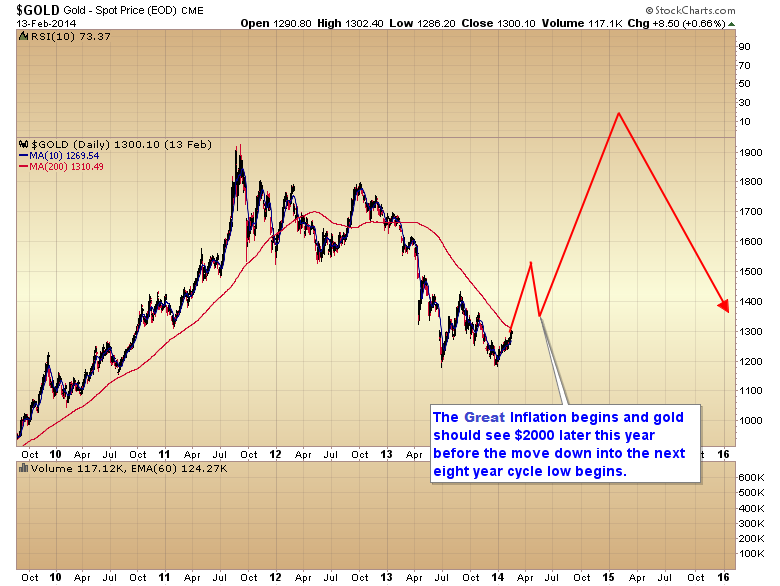
- once the stock market bubble pops in 4-5 months time, and Yellen starts QE5, the Great Inflation will begin in earnest and that
- gold will probably rocket from an intermediate bottom of around 1350-1400 this summer, to test $2000 by the end of the year.
Summary
Over the next couple of months everything should generally rise together but once the dollar puts in an intermediate bottom sometime in March or April, commodities and gold will move down into an intermediate correction as the stock market completes its final blow off top.
After the stock market parabola collapses later this summer it will be time to put the pedal to the metal in the commodity markets, and especially the precious metal markets as the Great Inflation begins in earnest.
[Editor’s Note: The author’s views and conclusions in the above article are unaltered and no personal comments have been included to maintain the integrity of the original post. Furthermore, the views, conclusions and any recommendations offered in this article are not to be construed as an endorsement of such by the editor.]
*http://goldscents.blogspot.ca/2014/02/another-piece-of-puzzle-falls-into-place.html (Subscribe to GOLD SCENTS by Toby Connor by Email; To subscribe to the premium service, a daily and weekend market update, click here)
Related Articles:
1. Stock Market Will Collapse In May Followed By Major Spike in Gold & Silver Prices! Here’s Why

The unintended consequences of five years of QE are coming home to roost! In May or early June the stock market parabola will collapse…followed by a massive inflationary spike in commodity prices – particularly gold & silver – that will collapse the global economy. Read More »
2. Is This Market Correction – an Opportunity to Buy – or a Signal to Sell?
Stock market volatility, directed mostly to the downside this year, has caught the attention of anyone with funds at risk. The obvious question on most people’s minds is whether to get out or to put more money in. Advice going both ways is readily available. Here are some such articles. Take them into account and make your own decision regarding whether this correction is an opportunity to buy or a signal to sell. Read More »
4. Yes, You Can Time the Market – Use These Trend Indicators
Remember, the trend is your friend and now you have an arsenal of such indicators to make an extensive and in-depth assessment of whether you should be buying or selling. If ever there was a “cut and save” investment advisory this article is it. Words: 1579 Read More »
5. This Chart of the Dow Suggests “Bring on 2014 – We Ain’t Seen Nothin’ Yet!”

The Dow is up almost 28% but the chart below showing how it’s 12% annualized gain over the past 5-years compares with past bull markets suggest we are probably not at a top – that “We ain’t seen nothin’ yet!” Take a look. Read More »
6. Relax! Take Stock Market Bubble Warnings With a Grain of Salt – Here’s Why

Bubble predictions are headline-grabbing claims that are sure to attract reader/viewership and more than a few worried individuals who will be pushed to act but, like all forecasts, these bubble warnings should be taken with a grain of salt. Read More »
7. Stock Market Bubble & Coming Recession? These Charts Say Otherwise
The real value of the stock market is positively correlated, over time, with the amount of freight hauled by the nation’s trucks (in other words, the physical size of the economy has a lot to do with the real, inflation-adjusted value of the economy) and the latest numbers (see chart) strongly suggest that we are not in a stock market bubble. Read More »
8. The Stock Market: There’s NOTHING to Be Bearish About – Take a Look
There’s nothing to be bearish about regarding the stock market these days. I’ve reviewed my 9 point “Bear Market Checklist” of indicators and it is a perfect 0-for-9. Not even one indicator on the list is even close to flashing a warning sign so pop a pill and relax. There’s no immediate danger threatening stocks. Read More »
9. Pop a Pill & Relax ! There’s NO Immediate Danger Threatening Stocks
Right now there’s nothing to be bearish about. I say that with conviction, because my “Bear Market Checklist” is a perfect 0-for-9. Heck, not a single indicator on the list is even close to flashing a warning sign. We’ve got nothing but big whiffers! Take a look. Pop a pill and relax. There’s no immediate danger threatening stocks. Read More »
10. Latest Action Suggests Stock Market Beginning a New Long-term Bull Market – Here’s Why

There are several fundamental reasons to believe that this week’s stock market activity, where the S&P 500 has moved more than 4% above the 13-year trading range defined by the 2000 and 2007 highs, could mark the beginning of a long-term bull market and the end of the range-bound trading that has lasted for 13 years. Read More »
11. Sorry Bears – The Facts Show That the U.S. Recovery Is Legit – Here’s Why

Today, I’m dishing on the unbelievable rebound in residential real estate, pesky rumors about the dollar’s demise and a resurgent U.S. stock market. So let’s get to it. Read More »
12. Correlation of Margin Debt to GDP Suggests Stock Market Has More Room to Run
Are stocks in a bubble? While leverage has returned to the stock market driving up stock prices and aggregate demand in the process, margin debt is still shy of its all-time high as a percentage of GDP, so there is certainly some headroom for further rises. A look at the following 5 charts illustrate that contention quite clearly. Read More »
13. Stocks Should Have a Record-Breaking Year According to These 7 Bullish Fundamentals
“A sluggish economy, political gridlock, tepid earnings, the European debt crisis, high gasoline prices…” I can’t really argue with Barron’s depiction of the current market environment yet, against all these seemingly negative conditions, the stock market keeps surging higher. Can it possibly continue, though? Read More »
14. Market Returns to Be Dismal Over Next 10 Years! Here’s Why

If you have 401k assets, are a financial professional or individual investors looking to construct portfolios and not move monies very often, and looking to beat inflation over an extended period of time, the chart below is well worth being aware of. Read More »
15. End of “Wall Street Party” Will Be a Catastrophe! Here’s Why
The markets are considerably, fantastically overbought and that whatever happens after this “Wall Street Party” is going to be a sort of catastrophe. Here’s why. Read More »
16. Stock Market Bubble Going to Burst & Unleash Destructive Forces on Global Economy
The Fed has manufactured a parabolic move in the stock market…which is much more aggressive (and thus even more unsustainable) than witnessed at either the 2000 or 2007 stock market tops. Parabolas always collapse – there are never any exceptions – so when the pin finds this bubble it’s going to take down not only our stock market, but unleash a destructive force on the global economy. Read More »
17. Warren Buffett’s Favorite Valuation Metric Suggests Stock Market Is OVERvalued by 15%

Here’s some perspective on the potential value of the U.S. equity market using Warren Buffett’s favorite valuation metric – total stock market capitalization relative to GDP. Read More »
18. These Indicators Suggest Stock Market Returns Are “Too Good To Be True”

Current macro conditions indicate that we are in a sweet spot for equity returns…that global growth is continuing and there is little or no tail risk in the immediate future. It’s time to get long equities…but I have this nagging feeling that these market conditions are too good to be true. If you look, there are a number of technical and fundamental clouds on the horizon. Read More »
19. Bookmark This Article: The Stock Market Will Crash Within 6 Months!
Until recently, I have not used the term “stock market crash”. I do not take using this term lightly. It brings with it major repercussions. I am now breaking out this phrase because of the current state of the stock market. This stock market crash will occur within the next six months from today… The markets will fall within a combined day/few days a total of at least 20%. Bookmark this article. Read More »
20. These 2 Stock Market Metrics Make Me Feel Uneasy – What About You?
It’s been an amazing run in the stock market but…I start to feel a bit uneasy about things when I see all news reported as good news, because it either means the economy is getting better or more QE is coming. The fact, though, is that the market is just driving higher on what looks like sheer optimism of continued QE and little else. You can see this optimism in two indicators you’ll recognize. Read More »
21. 4 Clues That a Stock Market Collapse Is Coming
You might be well advised to keep your powder dry and your portfolio small – or even be tempted to sell everything and wait for the storm to blow over [given the 4 clues put forth in this article]. Read More »
22. Stocks Will UNDERPERFORM Bonds Over Next 10 Year Period!
The stock market is likely to experience a 4-year overall market loss of -25%, followed by positive 9% average annual total returns for the S&P 500 over the subsequent 6-year period, which would compound to produce a 10-year total return averaging 2.3%. Read More »


Charts are wonderful but for me I think my GUT chart indicates that for whatever reason PM’s will start to reclaim much of if not all of their old record prices and may then even go way beyond them, to much higher prices because things are getting “IFY” in the global paper money market.
Even forgetting about the US stock market, since PM are traded globally, any change in a one Countries PM value status will effect the entire market and since we are all interconnected these days the trades will happen at ever faster rates (pun intended) which will tend to leave small and medium traders out in the cold cruel world to fend for themselves.
Good luck