One of the crucial measures of the global economy – the most recent 3 month average global trade momentum – slumped the most since the financial crisis of 2008. It wasn’t because of the USA but, rather, Asia, and, in particular, China. Below are specific details along with some very illustrative charts.
The above edited introductory paragraph, and the edited excerpts below, comes from an article by Wolf Richter entitled Global Trade Dives Most since the Financial Crisis which can be read in its entirety at its original source HERE.
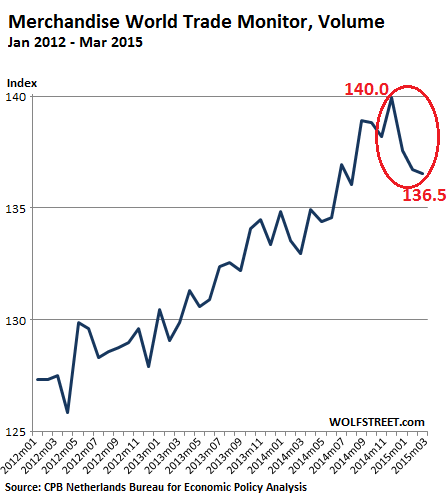
The CPB Netherlands Bureau for Economic Policy Analysis, a division of the Ministry of Economic Affairs, just released its latest Merchandise World Trade Monitor, which covers global import volumes as well as global export volumes. The index dropped 0.1% in March to 136.5, after having already dropped 0.7% in February, and 1.7% in January. The index, which was set at 100 in 2005, is now down 2.5% from the peak of 140.0 in December. That 3.5-point decline was the sharpest since the Financial Crisis.
This chart, going back to January 2012, doesn’t exactly inspire confidence in the current state of the global economy:
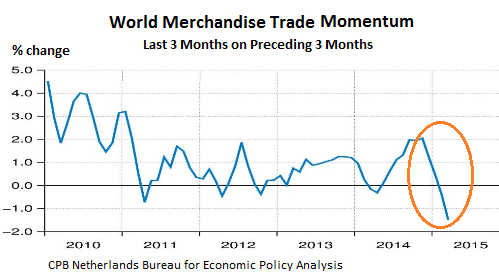
To mitigate the volatility of these kinds of monthly numbers, the CPB offers a measure of trade volume “momentum,” which it defines as “the change in the three months average up to the report month relative to the average of the preceding three months.”
That trade momentum measure slumped 1.5% in March, the largest monthly decline since April 2011, after having edged down 0.4% in February. It now amounts to the most negative “momentum” since the Financial Crisis.
This chart, going back to 2010, looks even worse than the prior chart. This sort of thing isn’t supposed to happen in an expanding, or even a stagnating, global economy:
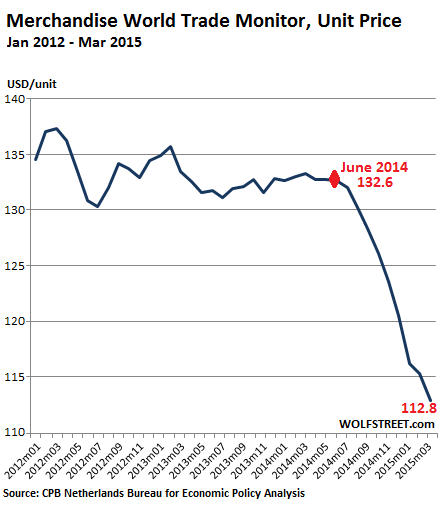
Both of the measures above involve import and export volumes. With volumes now actually declining and with new shipping capacity coming on line throughout the period, pricing per unit, in dollars, has plunged 15% since June 2014, and nearly 20% since the peak in March 2011. It’s now at the lowest level since May 2009:
The trade debacle wasn’t spread evenly, however. For March, the CPB reported:
“A positive turnaround occurred in both import and export growth in advanced economies. Imports bounced back strongly in the United States. They contracted deeply in Japan however. In emerging economies, import growth accelerated, but export growth became heavily negative on account of a deep fall in emerging Asia’s exports.” – and that would be mostly China.
Hard-landing gurus have been predicting an imminent end of the China bubble for years but there was no hard landing, or a soft landing, or any landing for that matter. China just kept on flying, fueled by an enormous credit bubble and monetary propellants, but now it’s running out of air.
Related Articles from the munKNEE.com Vault:
1. 70% Probability of Recession In China By 2020 – Here’s Why
I think there is a 70% probability that it will do so within the next five years and the probability that China will suffer either a hard landing OR a long period of Japanese-style stagnation…is over 95%. Read More »