A lock-step relationship has existed between gold and U.S. debt for most of U.S. history. If the U.S. debt continues to increase at the same rate as the last ten years, then it will reach $26 trillion by 2020. This is a good indicator for a gold price of at least $2,500 per ounce in the near future.

To see the article in speech form as presented at the 22nd Annual Empire Club of Canada Investment Outlook Luncheon, Toronto, Canada please go HERE.
Stock Market
The monetary policy of low interest rates…on the part of the world’s central banks have caused bubbles in stocks, bonds, real estate, art, and exotic cars. These are not likely to continue higher in 2016, and the risk of a major correction looms…
While it is clear that the global economy is contracting and there are numerous vulnerabilities, several valuation methodologies summarize current market fundamentals and provide an excellent indicator of future trends. They are the Buffet Indicator, the Shiller PE Ratio, and the Tobin Q Ratio.

The Buffett Indicator
The Buffett Indicator uses the total market capitalization of U.S. equities divided by GDP. The only other times the Buffett ratio exceeded 100% (it’s currently 123.4%) was just prior to the tech crash in 2000, and the credit bubble in 2008.

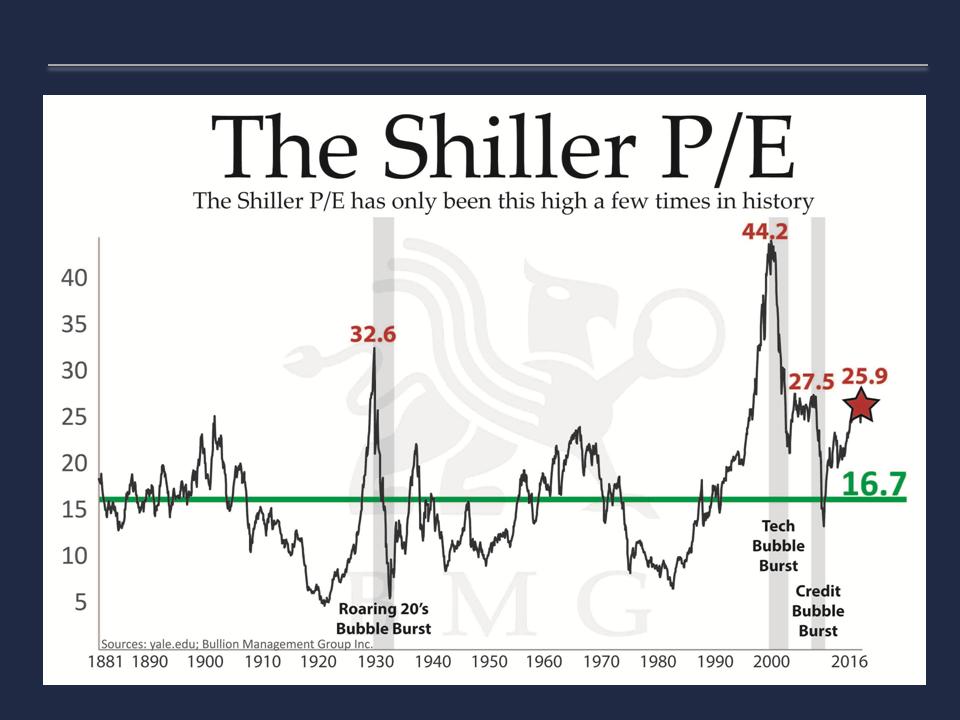
The Shiller P/E Ratio
The 134-year average Shiller P/E ratio is 16.7, whereas the current ratio is 25.9, or 55% overvalued. The ratio has only been this high on three other occasions: 1929, 1999, and 2007. Each time it happened, stocks dropped by over 50 percent, and didn’t recover for years.
Tobin’s Q Ratio
The Tobin Q ratio, which measures market value versus replacement cost, is considered one of the better long-term indicators of a pending market decline. The current Tobin Q ratio exceeds the 70-year average of 0.7 by 58%. The ratio rose above the average in 2000 and 2008.

Margin Debt
This time, however, the correction could be much worse than in either 2000 or 2008. Not only do we have a significant overvaluation, but historically high margin debt which will accelerate the decline due to margin calls. These conditions provide investors with the opportunity to sell high and take a profit.

China & Gold
The future outlook for gold pricing is not complete without understanding the implications that China will have. China has been increasing its gold reserves, and has made a number of strategic moves that threaten the U.S. dollar’s reserve currency status.
- China has signed 26 currency swap agreements wherein the U.S. dollar is no longer used to settle trade imbalances.
- The Asian Infrastructure Investment Bank has been formed as an IMF alternative to provide loans to BRIC countries.
- A yuan currency exchange hub has been created in Canada with ICBC bank.
- China has developed an alternative to the SWIFT system of international currency transfers, and Russia is developing its own version.
- China’s currency has been accepted into the IMF’s SDR program, with full implementation in the fall of 2016, at a 10.92 allocation.
- The Shanghai Gold Fix, to be introduced in the spring of 2016, has a good chance of eliminating short selling on the COMEX because the Shanghai Gold Fix is going to be only physical, without any paper market dilution. If traders try to drive gold’s COMEX, price down through shorting, arbitrage traders in Shanghai will quickly counter the move.
In 2015, the result of these changes was already showing, as 71% of U.S. Treasuries were purchased by the Federal Reserve with newly issued currency as demand for U.S. dollars decreased.
Gold in the 1970s
Finally, to reinforce the “Buy Low” opportunity, a comparison to the cyclical gold correction from 1974 to 1976 and the subsequent price rise serves as a good example. At that time, after a 445% rise from 1971 gold declined 45%, gold sentiment was at record lows, and the media was full of negative gold commentary, as it is today.
- On March 26, 1976, the New York Times stated: “For the moment at least, the gold party seems to be over.”
- It also quoted a Citibank letter that declared, “Gold was an inflation hedge in the early 1970s, but money is now a gold-price hedge.”
- It suggested that the rout was due to the “victorious dollar,” the “victorious dollar” that has lost 80% of its purchasing power against gold since that day in 1976.

After two years of declines, many investors sold their gold holdings and vowed never to invest in gold again. However, in the fall of 1976, gold began an ascent that saw it rise 750%, peaking at $850 a troy ounce three years and four months later. After a 3-year correction, the same opportunity to buy low exists today, just as it did in 1976. Of course, conditions were different then: the stock market was not in a bubble, and total U.S. debt was $800 billion – less than last year’s annual deficit.
 (Incidentally,] I am often asked how high will the price of gold go, and do I still think it will hit $10,000 per troy ounce, as described in my book. The conditions detailed in my book are still very much in place, and many of the vulnerabilities have actually increased. To order your copy of “$10,000 Gold: Why Gold’s Inevitable Rise Is the Investor’s Safe Haven” please visit: Amazon.com, Amazon.ca, Chapters.Indigo.ca or info@10000goldthebook.com)
Gold & U.S. Debt
A lock-step relationship has existed between gold and U.S. debt for most of U.S. history. If the U.S. debt continues to increase at the same rate as the last ten years, then it will reach $26 trillion by 2020. This is a good indicator for a gold price of at least $2,500 per ounce in the near future.

“Follow the munKNEE” on Facebook or via our FREE bi-weekly Market Intelligence Report newsletter (see sample here , sign up in top right hand corner)
Related Articles from the munKNEE Vault:
1. Nick Barisheff: $10,000 Gold is Coming! Here’s Why
This is not a typical bull market. Gold is not rising in value, but instead, currencies are losing purchasing power against gold and, therefore, gold can rise as high as currencies can fall. Since currencies are falling because of increasing debt, gold can rise as high as government debt can grow. Based on official estimates, America’s debt is projected to reach $23 trillion in 2015 and, if its correlation with the price of gold remains the same, the indicated gold price would be $2,600 per ounce. However, if history is any example, it’s a safe bet that government expenditure estimates will be greatly exceeded, and [this] rising debt will cause the price of gold to rise to $10,000…over the next five years. (Let me explain further.] Words: 1767.
2. Nick Barisheff: Gold Could Easily Double in Price – Here’s Why
The consequences of the total economic mismanagement by world governments and central banks for the last hundred years will eventually result in my forecast of $10,000 gold and $500 silver being fulfilled.
4. A “perfect storm” Is Coming To Global Stock Markets In 2016
Batten down the hatches, because a “perfect storm” is coming to global stock markets in 2016 according to the technical analysis team at UBS.
5. The Stock Market Will Tank In 2016 – Here Are 10 Reasons Why
The top 14 investment banks ALL project that the S&P 500 will go up in 2016 with an average increase of 6.5%…This is understandable. A falling stock market is bad for business and these banks depend and thrive on the bullish excitement and expectations of their clients. However, we at Carden Capital, have adaptive strategies that can handle up and down markets, so we can tell it like it is, and in this case, we are highly confident that the projections of those 14 investment banks are going to be dead wrong. In fact, we are confident that the market will be down in 2016, and will enter into a corrective phase. With that introduction, we present to you the top 10 reasons the stock market will tank in 2016.
6. 1 (or more) of These 6 Things Could Poison Stock Market Returns In 2016
I am convinced that trouble is coming in 2016 that could poison your returns if you are not careful. Here are 6 possibilities.
7. A Reminder Of What Usually Happens to Stocks When the Fed Raises Rates: Ouch!
I know, I know, no one likes the bearer of bad news — especially when it comes to stock prices – but someone needs to remind you what usually happens to stocks when the Fed raises rates so it might as well be me. They drop. Let me explain.
8. Coming Stock Market Crash Will Mirror Debacles Of 2001 & 2008
Given that this imminent recession will begin with the stock market flirting with all-time highs, the next stock market crash should be closer to the 2001 and 2008 debacles that saw the major averages cut in half.
9. If You Own Stocks Then This Article Is a MUST Read
Don’t be one of the people who don’t understand the vital importance of the bond market and what it’s telling you right now. This knowledge could help you avoid a huge hit to your net worth over the next 12-24 months. Here’s why.
10. Get Ready: Stock Market Crash Coming in 3-6 Months – Here’s Why
The deteriorating junk bond market, along with rising credit spreads, is indicating that we will have a stock market correction in about 3-6 months. Here are the details.
11. This Ratio Is An Ugly Warning Sign For the Stock Market
Historically, the performance of the S&P 500 Index relative to the U.S. Dollar Index has been a good indicator of bull and bear markets but it has underperformed the Dollar Index since mid-2014. It’s an ugly warning sign for the market. I see the stock market moving downward from here.
12. Will It Be China That Pricks the Stock Market Bubble?
Let’s imagine the stock market as a whole bunch of balloons. One or two can pop loudly and everyone will jump and then laugh it off but, eventually, enough balloons will pop that the weight of the debris overwhelms the remaining balloons’ ability to keep the string aloft. Then your whole bunch falls down. In like manner, some kind of catalyst sets off every market collapse.The last balloon to pop isn’t any bigger or smaller than the others; it just happens to be last. What are some candidates for that last balloon?
Links to More Sites With Great Financial Commentary, Analyses & Entertainment:
ChartRamblings; WolfStreet; MishTalk; SgtReport; FinancialArticleSummariesToday; FollowTheMunKNEE; ZeroHedge; Alt-Market; BulletsBeansAndBullion; LawrieOnGold; PermaBearDoomster; ZenTrader; CreditWriteDowns;