munKNEE.com – A Fast & Easy Read of the Latest & Best Financial Articles
…The Fed has been trying to increase inflation, operating at the macro level, but what does inflation mean at the micro level — specifically to your household? Let’s do some analysis of the Consumer Price Index, the best-known measure of inflation.
The original article has been edited here for length (…) and clarity ([ ])
The Bureau of Labor Statistics (BLS) divides all expenditures into eight categories and assigns a relative size to each. The pie chart below illustrates the components of the Consumer Price Index for Urban Consumers, the CPI-U, which we’ll refer to hereafter as the CPI.
(Click on image to enlarge)
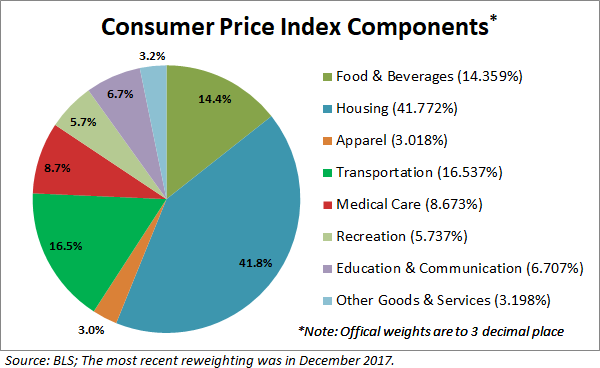
The slices are listed in the order used by the BLS in their tables, not the relative size.
- The first three follow the traditional order of urgency: food, shelter, and clothing.
- Transportation comes before Medical Care,
- Recreation precedes the lumped category of Education and Communication.
- Other Goods and Services refers to a bizarre grab-bag of odd fellows, including tobacco, cosmetics, financial services, and funeral expenses.
For a complete breakdown and relative weights of all the subcategories of the eight categories, here is a useful link.
The chart below shows the cumulative percent change in price for each of the eight categories since 2000.
(Click on image to enlarge)
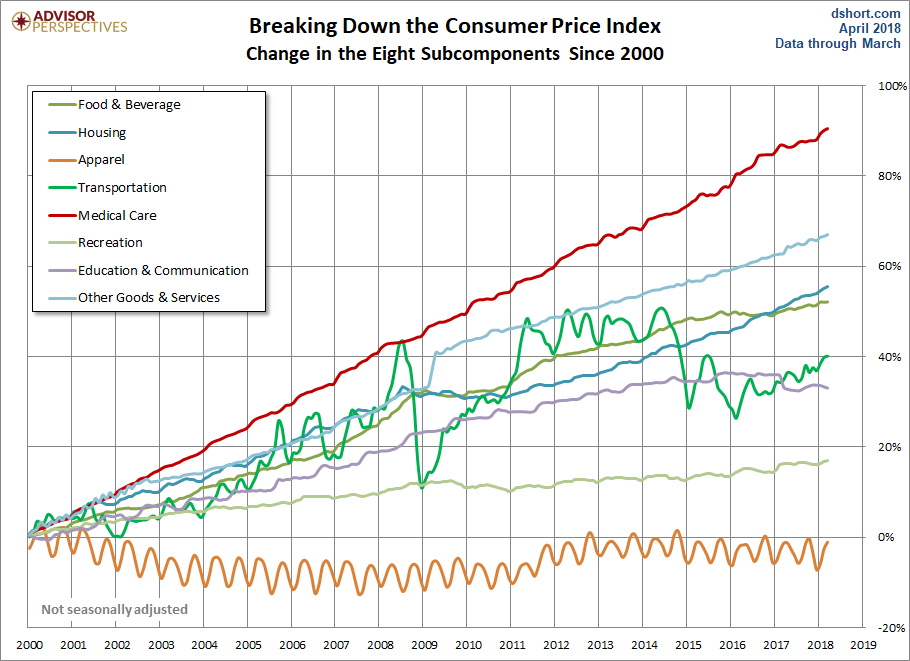
- Not surprisingly, Medical Care has been the fastest growing category.
- At the opposite end, Apparel deflated since 2000 and has nearly returned to those levels in recent years. Another unique feature of Apparel is the obvious seasonal volatility of the contour.
- Transportation is the other category with high volatility — much more dramatic and irregular than the seasonality of Apparel. Transportation includes a wide range of subcategories. The volatility is largely driven by the Motor Fuel subcategory. For a closer look at gasoline, see this chart in our weekly gasoline update.
The Ominous Shadow Category of Energy
The BLS does not lump energy costs into an expenditure category. Instead, it includes energy subcategories in Housing in addition to the fuel subcategory in Transportation. Also, energy costs are indirectly reflected in expenditure changes for goods and services across the CPI.
The BLS does track Energy as a separate aggregate index, which in recent years has been assigned a relative importance of 7.039 out of 100. In other words, Uncle Sam calculates inflation on the assumption that energy in one form or another constitutes 7.5% of total expenditures, 3.9% goes to transportation fuels — mostly gasoline. The next chart overlays the highly volatile Energy aggregate on top of the eight expenditure categories. We can immediately see the impact of energy costs on transportation.
(Click on image to enlarge)

The next chart will come as no surprise to families footing the bill for college tuition. Here we’ve separately plotted the College Tuition and Fees subcategory of the Education and Communication expenditure category. Note that the steady staircase in this cost matches the annual cost increases in late summer for each academic year.
(Click on image to enlarge)
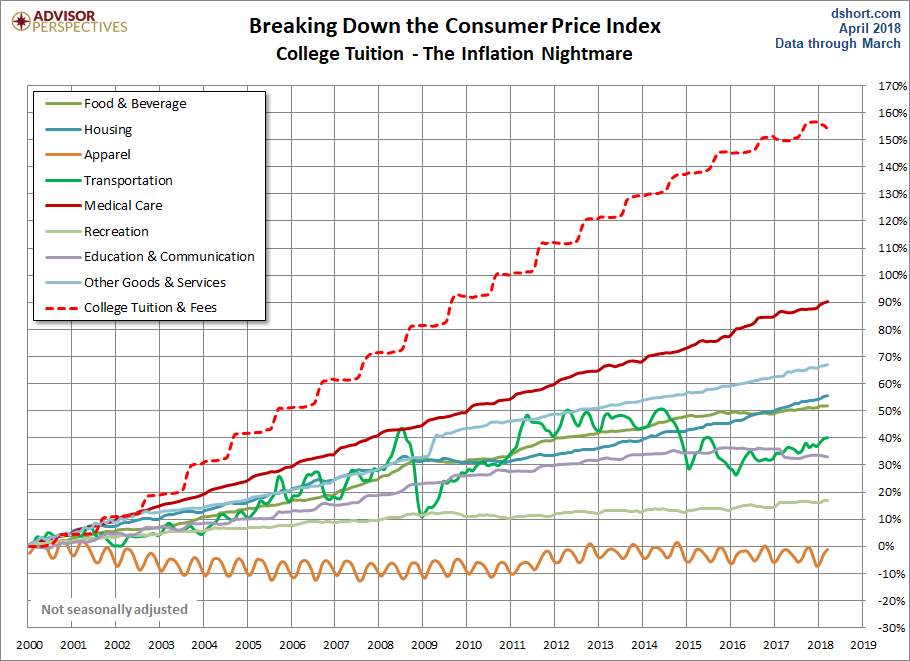
The tuition series in the chart above, however, is overly dramatic. The BLS calculates tuition based on the sticker price, which is higher than many, if not most, households pay. A New York Times piece, How the Government Exaggerates the Cost of College, explains that the government data ignores financial-aid grants which substantially lowers the real cost to consumers. For a more accurate view on college tuition, see the statistics at the College Board website.
Core Inflation
Economists and policymakers (e.g., the Federal Reserve) pay close attention to Core Inflation, which is the overall inflation rate excluding Energy and Food.
- This is a somewhat peculiar metric in that one of the exclusions, Energy, is an aggregate that combines specific pieces of two consumption categories: 1) Transportation fuels and 2) Housing fuels, gas, and electricity.
- The other, Food, is the major part of the Food and Beverage category. Note that “beverage” for the BLS means alcoholic beverages so coffee and Coca-Colas are excluded from Core Inflation, but Budweiser and Jack Daniels aren’t.
The next chart shows us the annualized rate of change (solid lines) and the cumulative change (dotted lines) in CPI and Core CPI since 2000.
(Click on image to enlarge)
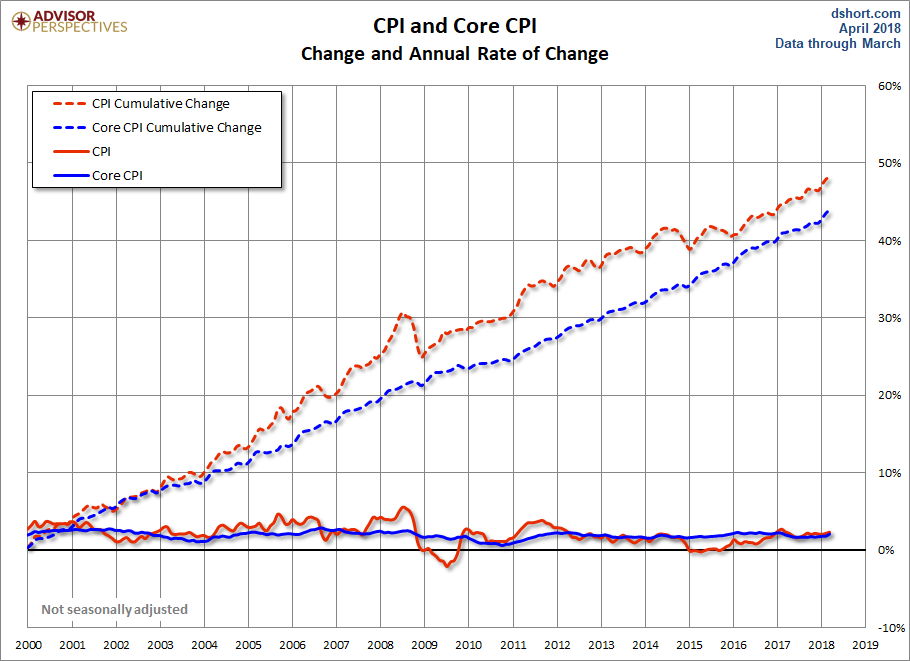
Consumers, especially those who’ve managed expenses over several years, are most closely attuned to the top line.
Inflation and Your Household
The universal response is to moan over price increases and take delight when prices are cheaper but, in reality, households vary dramatically in the impact that inflation has upon them.
- When gasoline prices skyrocket, a two-earner suburban family with long car commutes suffers far more than the metro family with short subway commutes or retirees with no commute.
- The pain is even more extreme for low-income households whose grocery money shrinks when gas prices rise, and remember, Uncle Sam excludes energy costs from Core Inflation.
- Households with high medical costs are significantly more vulnerable than comparable households with low expenses in this category.
- The BLS weights College Tuition and Fees at 1.613% of the total expenditures but for households with college-bound children, the relentless growth of tuition and fees can cripple budgets. Often those costs get bundled into loans that saddle degree recipients with exorbitant debt burdens. Of course, the Federal Reserve would point out that the right dose of Core Inflation (extended of course to wages) would enable debt-burdened college grads to pay down their loans with inflated dollars.
…[The above] brings us back to the Fed’s efforts to manage the level of Core Inflation. At the macro level, the Fed can doubtless make a theoretical case for manipulating inflation but…[are] their efforts — ZIRP and Quantitative Easing — achieving the desired goal?
Inflation has been tame in recent years…but the one thing we can be certain about is this: Inflation volatility has a painful effect on:
- lower income households,
- those on fixed incomes,
- those with higher ratios of tuition, transportation, or medical costs
- and all households whose discretionary spending is more dream than reality.
Related Articles From the munKNEE Vault:
1. Do Oil Prices Affect Inflation Expectations?
The claim that, in normal times, energy prices have a direct influence on long-term inflation expectations is puzzling, as it seems to imply that monetary policy is not able to offset price shocks even five or ten years down the road. If confirmed, it could have significant implications on how inflation dynamics are forecast. Hence, we believe that the claim warrants further scrutiny.
Every year, a vast amount of copper is used by the global economy to manufacture a wide variety of goods. It’s a major ingredient in big-ticket consumer goods like autos, appliances, electronics, and new homes. Simultaneously, copper is also gobbled up for many industrial uses including telecommunications, utilities, construction, and industrial machinery. Today’s infographic comes to us from Kutcho Copper, and it shows the red metal’s important role in the economy, as well as why it has become a famous economic bellwether.
3. These 5 Drivers Of Higher Inflation Are Starting To Kick In – Got Gold?
Investors got lulled into a state of inflation complacency [with] persistently low official inflation rates in recent years that depressed bond yields along with risk premiums on all financial assets – but that’s changing in 2018. Five drivers of higher inflation rates are now starting to kick in.
4. What Is the Likelihood Of High Inflation?
Recent economic data has bond yields jumping a little bit on the worry of higher future inflation. According to many this is the main concern behind the recent volatility in stock and bond markets so let’s see if we can’t put some of this data in perspective so we can better understand the risks to our portfolios.
5. BIG Inflation Is Coming & Smart Investors Will Use It To Generate Fortunes – Are You Ready?
The 3 charts below of the financial system strongly suggest that we are in for an inflationary shock in 2018 that is going to ignite a HUGE rally in commodities and other inflation hedges.
7. Get Prepared: The World Is Careening Towards An Inflationary Shock
A growing chorus of forecasters see inflation pressures emerging. Even if that’s true, it should be welcomed – not feared. Here’s why.
11. Inflation: What Is It? What Isn’t? Who’s Responsible For It?
Inflation is the debasement of money by the government. PERIOD. It is NOT a general increase in the level of prices for goods and services. These statements are critical to an understanding and correct interpretation of events which are happening today – or expected to happen – that are casually attributable to inflation. Let’s go one step further as to what inflation is, what it isn’t and who’s responsible for it.
12. Inflation Coming Like An On-Rushing Train – Here’s What Investors Should Do Now
For all the latest – and best – financial articles sign up (in the top right corner) for your free bi-weekly Market Intelligence Report newsletter (see sample here) or visit our Facebook page.