Look for Stocks to Peak Soon and for Gold to Regain its Leadership
The S&P 500 has rebounded about 100% in 100 weeks. What crisis? What new normal? The economy is recovering and happy times are back again. Old normal is back. Stocks for the long run! Permabears be damned! The permabulls are back! Rates are low, core inflation is low. It’s Goldilocks time! [Hold on, though. That’s only half the picture and the other half does not paint such a rosy picture. Let me explain.] Words: 959
So says Jordan Roy-Byrne (www.thedailygold.com) in an article* which Lorimer Wilson, editor of www.munKNEE.com, has further edited ([ ]), abridged (…) and reformatted below for the sake of clarity and brevity to ensure a fast and easy read. (Please note that this paragraph must be included in any article re-posting to avoid copyright infringement.) Roy-Byrne goes on to say:
US stocks are, [in fact,] following the same pattern they’ve followed in the last three bear markets. The midpoint crash (1907, 1937, 1974, 2008) gave way to a furious rebound in each case. Following 1937, the market retraced 62% of its losses. Following 1907 and 1974, the market peaked three and a half years later after retracing roughly 95% of the losses. Three and a half years and a 95% retracement equates to the S&P 500 peaking at 1500 in April of this year, exactly as I projected in our 2011 Market Outlook. [Editor’s Note: Interestingly, a 1500 top for the S&P 500 corresponds with a previous article I wrote entitled “S&P 500 Likely To Top Out at 1400 – 1500 & Then Topple to 400! Here’s Why” which you can read here.] That forecast is on track as the market gains momentum yet as bearish forces quietly accumulate. [Let’s first look at market…] sentiment.
Sentiment for US Stocks Is At 10-Yr High!
The following chart is from data from a Bank of America Merrill Lynch survey of asset managers and hedge funds who cumulatively manage nearly $1 Trillion. The data shows what percentage are overweight or underweight US equities. The percentage of managers overweight US equities has soared in recent months and is basically at a 10-year high.

Here are two more charts courtesy of the Short Side of Long. The data is from the AAII and Investors Intelligence.

The 12 week-MA of the bullish sentiment is well north of peaks in the past five years.

The 12-week MA of Investors Intelligence bulls is at its highest level since January 2007 [and] there is good chance it will surpass the 2007 level in the coming weeks. This growing bullish sentiment will coincide with the S&P 500 hitting major multi-year resistance. Excessive bullish sentiment coupled with multi-year resistance is not exactly a recipe for a major breakout. It’s a recipe for the end to this cyclical bull market.

Moreover, as we’ve noted time and time again, the factors that will cause stocks to reverse are the same factors that will propel Precious Metals into the early stages of a bubble. [Editor’s Note: For more on the effect of QE on the price of PMs go here.] Increased monetization will be required as interest rates begin to rise and as the economy fails to grow fast enough to mitigate the debt burden. New debts and the rollover of old debts will be financed at higher rates, thereby increasing the debt burden which in turn, impacts the governments ability to juice the economy.
Sign up for our FREE weekly “Top 100 Stock Market, Asset Ratio & Economic Indicators in Review”
Higher rates won’t be good for stocks and higher rates won’t mitigate inflation or inflation expectations. The reason being, when you have a super high debt load (as most Western nations do) higher rates only exacerbate the debt burden. It will force local, state and the federal government to cut back, which has an impact on GDP. Higher inflation will also cut into corporate margins. We are expecting a mild bear market and not the 40%+ decline we’ve seen recently.
Sentiment and the Future of Gold
A survey of wealth managers in Canada showed only 33% of advisers as being bullish on Gold. That figure was 64% as recently as Q4 2010. [While ] this doesn’t mean Gold will immediately soar… it [does] tell us that Gold’s downside is limited as sentiment has shifted significantly.
Who in the world is currently reading this article along with you? Click here to find out.
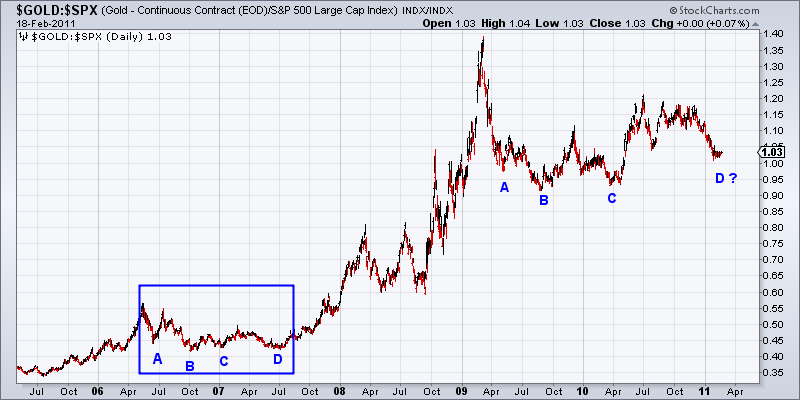
With stocks nearing major resistance carrying excessive bullish sentiment and Gold’s downside limited, let’s take a look at the Gold/S&P 500 chart [below]. The 2009-2010 price action has some similarities to the 2006-2007 price action. The chart shows that this is likely a good time to increase positions in Gold and reduce positions in stocks.
Conclusion
Regarding stocks: If you are a regular Joe investor [then] now is your opportunity to be a contrarian and look smart in a few years. Mainstream managers now feel vindicated and feel a chance to promote stocks again. Don’t make the mistake many have already made twice. I’m writing this for the mainstream investor and the retirement investor because I don’t want to see them get sucked back into the market at the wrong time courtesy of asset managers who will find any reason to promote stocks.
Regarding gold: Gold is holding up well while the focus is currently elsewhere. The hot money is out of Gold… and in the long run that is scary bullish.
In the coming months look for stocks to peak and for Gold to regain its leadership.
*http://www.financialsense.com/contributors/trendsman/time-to-dump-stocks-for-gold
Editor’s Note:
- The above article consists of reformatted edited excerpts from the original for the sake of brevity, clarity and to ensure a fast and easy read. The author’s views and conclusions are unaltered.
- Permission to reprint in whole or in part is gladly granted, provided full credit is given as per paragraph 2 above.
- Sign up to receive every article posted via Twitter, Facebook, RSS feed or our FREE Weekly Newsletter.
Stocks