Though the river of gold market analysis runs wide and deep on the Internet, precious little of that content is devoted directly to the most basic rationale for gold ownership. Here we fill that void in chart form – a quick reference for the first-time investor.
By Michael J. Kosares (USAgold.com) from an article* originally posted on GoldSeek.com under the title The case for gold ownership in ten charts you will never see on CNBC.
The same uncertainties that drove gold demand throughout the past decade in a half are still with us today. Investors fearing:
- some future Black Monday,
- a general bank or currency collapse,
- a 1930s-style economic depression, or
- a sudden and virulent inflation
took precautions by purchasing gold coins and bullion as a form of portfolio insurance. In fact, some analysts believe that current global monetary policy is setting us up for another economic crisis far worse than the near full meltdown in 2007-2008.
“Focusing all policy efforts on boosting inflation rather than on structural reforms to boost growth,” says Paul Singer, the outspoken and highly respected hedge fund manager, “will potentially be seen in retrospect as one of the most inexplicably ridiculous mass delusions in the history of economic and monetary policy in the developed world.” Mass delusion, it should be added, quite often precedes the black swan event.
The 10 charts below summarize gold’s impressive performance during the tumultuous first fourteen years of the 21st century.
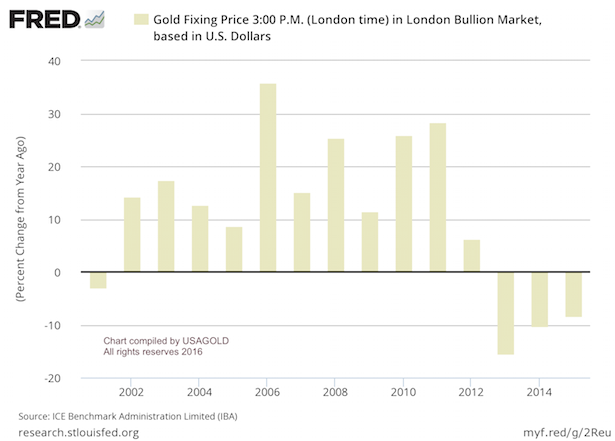
1. Gold’s Annual Rate of Return from 2001 through 2014
Chart 1 below presents a quick overview of gold’s annual rate of return from 2001 through 2014. An investment of $100,000 made in 2001 would have a market value today just under $440,000 even with the market correction of the past two years taken into account. The average annual return over the period was just over 12%. By comparison, stocks over the same period (at the 18,000 level for the Dow Jones Industrial Average), averaged a return of just under 4% annually. Also keep in mind that over the period stocks enjoyed two bull markets and gold only one! A 12% annualized return in a no yield environment represents a phenomenal.
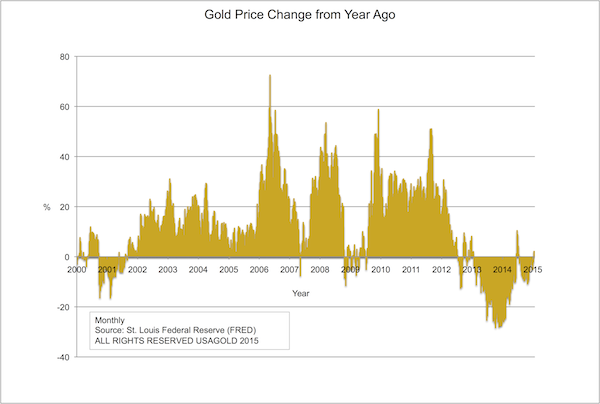
2. Gold’s Annual Gain Over the Same Month in the Previous Year
Chart 2 below is a magnification of Chart 1. It shows gold’s annual gain over the same month in the previous year. Its most telling features are the spikes running concurrent to times of economic and financial stress. One lesson to be drawn from this chart is that the best time to buy gold is when everything is quiet, and the market is declining or running sideways. The largest year over year gains – in some cases 60% to 70% – were realized when gold was purchased on the downslopes. These spikes were accompanied by heavy physical gold demand both in the United States and abroad with national mints and refiners running 24-hour schedules to keep up with coin and bullion demand.
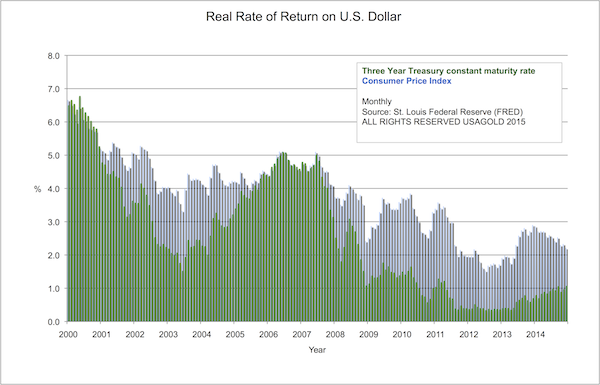
3. Gold’s Real Rate of Return on USD
Chart 3 below offers the kind of fundamental analysis that drives the thinking of professional investors and portfolio managers. A real rate of return – the gain on yields after inflation – over an extended period of time is essential to maintaining and building wealth. As you can see in this chart, there has not been a real rate of return on dollar savings and highly-rated yield instruments since the 2007-2008 financial crisis, and prior to that true yield was scant. (The blue areas reflect the negative real rate of return.) As a result, investors have been forced to raise their risk profiles – an unhealthy circumstance that also raises the prospect for significant speculative losses and argues persuasively in favor of gold diversification.
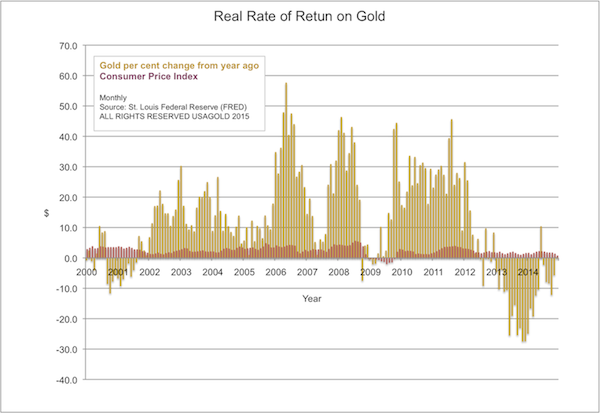
4. Gold’s Real Rate of Return Since 2000
Chart 4 below shows the impressive real rate of return on gold ownership since 2000. Nothing argues for a gold diversification under the current economic circumstances as forcefully as this single chart. It requires no embellishment. The gold areas above the red CPI bars reflect the real rate of return. (Please see the commentary under Chart 1.)
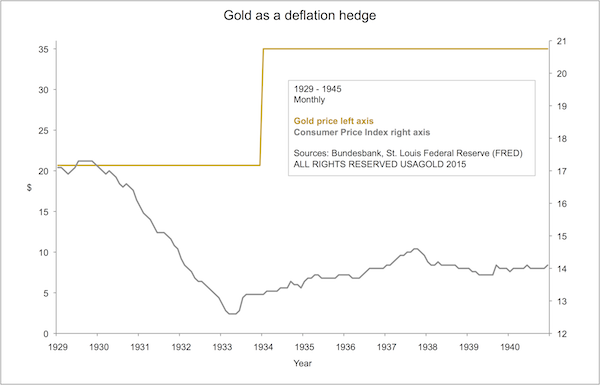
5. Gold’s Viability as a Deflation Hedge
Chart 5 below demonstrates gold’s viability as a deflation hedge. During the Great Depression of the 1930s, the price of gold was fixed at $20.67 per ounce, and from 1933 at $35 per ounce. When the general price level fell, it gained in purchasing power simply because of the fixed benchmarks. A second advantage to gold ownership under deflationary circumstances is the metal’s status as a stand alone asset that is not simultaneously someone else’s liability. Because it is an asset the investor holds outside the financial system, it does not carry the attendant counterparty risk associated with bank deposits, annuities, common stocks, bonds and other financial assets. As such, it might very well be the ideal hedge and safe haven under deflationary circumstances.
Not into Facebook or Twitter? No problem. Subscribe (sample here) to our FREE “Market Intelligence Report” newsletter for access to every new article posted in the last day or two. It has an easy “unsubscribe” feature should you wish to do so at any time for any reason.
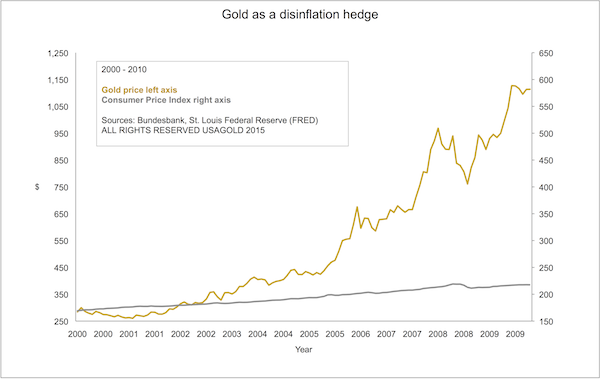
6. Gold’s Effectiveness as a Hedge Against Disinflation
Chart 6 below isolates a recently attained benefit to gold ownership not widely known or publicized – its capacity to effectively hedge against disinflation. As the past disinflationary decade of asset bubbles, financial institution failures and global systemic and sovereign debt risk unfolded, gold proved capable of consistently delivering the goods under disinflationary circumstances. During the 2000s – an era of indisputably disinflationary circumstances – gold rose from just under $300 per ounce in the early 2000s to just over $1900 per ounce by 2011, a gain of over 600%. Since then, gold has taken a breather. As this page is posted in early 2015, it is trading in the $1300 per ounce range — still up over 400% thus far in the new “disinflationary” century.
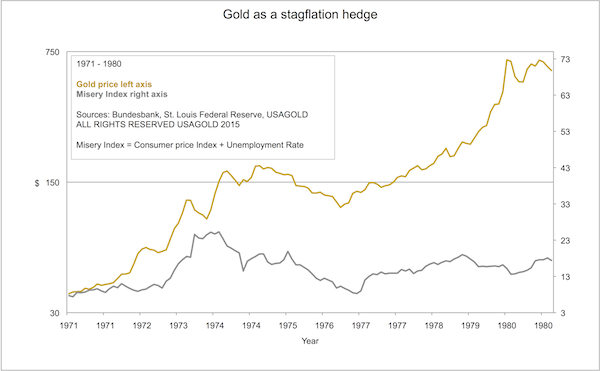
7. Gold’s Effectiveness as a Hedge Against Stagflation
Chart 7 below depicts gold’s utility in the other malady that situates itself between inflation and deflation – stagflation. President Ronald Reagan famously added the unemployment and inflation rates together and called its sum the Misery Index. As the Misery Index moved higher throughout the decade so did the price of gold. At a glance, the chart establishes gold as an effective stagflation hedge to go along with its inflation, deflation and disinflation credentials. The Misery Index more than tripled in that ten-year period but gold, as the chart shows, rose by nearly 16 times.
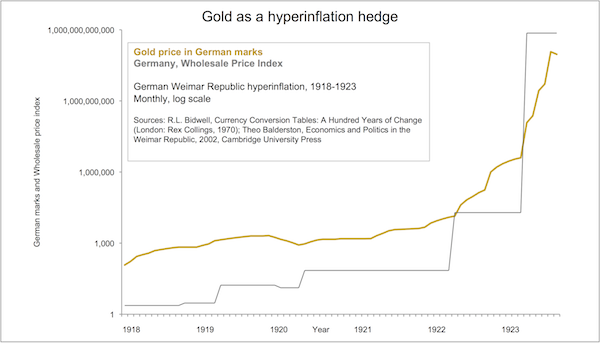
8. Gold’s Effectiveness as a Hedge Against Hyperinflation
Chart 8 below demonstrates the value of gold ownership during a hyperinflationary crisis. The numbers you see in the left axis are not a misprint. At the height of Germany’s Weimar Republic hyperinflation, gold traded at 118.23 billion marks per ounce. In 1918, it traded at 87 marks per ounce. Wholesale prices went from 2.34 to 725.7 billion index points in the course of five years. At the height of the inflation, prices were doubling every two days – a nearly immeasurable inflation rate. An individual’s life savings could not purchase a newspaper. As you can see by the chart, those who converted their marks into gold early in the process were able to hold on to their savings. Those who did not were left to the destructive forces unleashed by the hyperinflation.
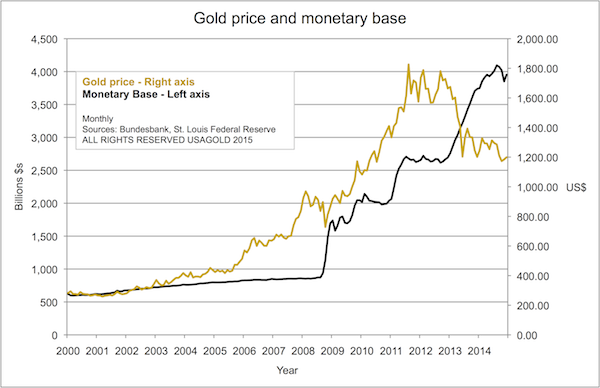
9. Gold’s Price in Relation to Monetary Base Growth
Chart 9 below illustrates the relationship between growth in the monetary base (otherwise known as quantitative easing) and the gold price. Quantitative easing, as you probably already know, is the polite term for printing money, the process that ultimately and without warning unleashed the nightmare German hyperinflation described in the previous chart. The interesting feature in Chart 9 is the sudden and inexplicable divergence between the two data sets starting in 2013. This divergence, in our opinion, presents an attractive buying opportunity for the long time accumulator of gold, whether or not the money printing creates runaway inflation. Though some might see this chart as depicting a direct correlation between gold and quantitative easing, we see the two as reacting to the same stimulus, i.e., a bad economy. Central banks react by printing money. Investors react by buying gold. Though the Federal Reserve has curtailed its quantitative easing program for now, there is no indication it is off the table permanently.
10. Gold’s Price Performance After the Abandonment of the Gold Standard
Chart 10 below might be the most important of our grouping in that it helps the first-time gold investor understand what sort of an economy will govern investment portfolio choices for the foreseeable future.
When the United States abandoned the gold standard in 1971 and freed currencies to float against one another, the era of central bank monetary experimentation began. We are still in that era. Predicting the course of the economy and the financial markets with any degree of reliability in a fiat money environment is problematic, if not impossible. It is this permanent aura of economic insecurity that has pushed gold demand since the 1970s and driven it to record heights since 2008.
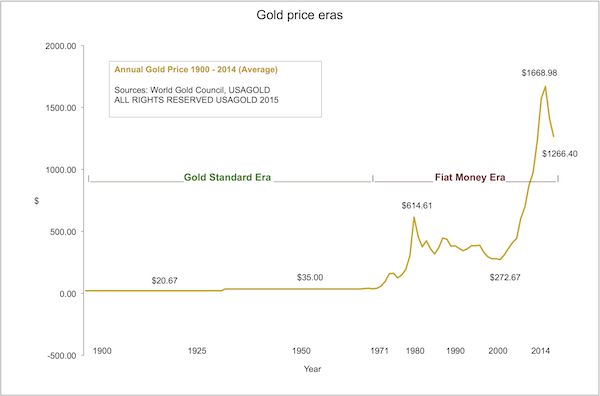
Former Fed chairman Alan Greenspan, who understands the nature of monetary experimentation better than most, recently said, “Gold is a good place to put money these days given its value as a currency outside of the policies conducted by governments.” Until the monetary system is once again put on a stable footing, gold ownership will continue to be at the forefront of thinking for private and public investors alike – and on a global basis.
The article above is presented courtesy of Lorimer Wilson, editor of www.munKNEE.com (Your Key to Making Money!), and www.FinancialArticleSummariesToday.com (A site for sore eyes and inquisitive minds) and has been edited, abridged and/or reformatted (some sub-titles and bold/italics emphases) for the sake of clarity and brevity to ensure a fast and easy read. This paragraph must be included in any article re-posting to avoid copyright infringement.
*http://news.goldseek.com/GoldSeek/1423254111.php – © GoldSeek.com, Gold Seek LLC (USAgold.com‘s newsletter is offered free of charge and specializes in issues and opinion of importance to owners of gold coins and bullion. If you would like to register for an e-mail alert when the next issue is published, please visit this link)
Related Articles from the munKNEE Vault:
1. Gold & Silver Have a Bright Future – Here Are the Many Reasons Why
Optimism, hype, wishful thinking, hope – call it what you will (unabashed cheerleading?) – abounds regarding the future for the price of both gold and silver. Below are just a few such views. Read More »
2. Gold: 42 Specific Peak Price Predictions
Over the years only 42 pundits have been bold enough to provide a specific date as to when their forecast for the future price of gold (and silver, in some cases) would be realized. This article provides that information along with the criteria & rationale for their determinations. Read More »
3. Does What Happened in 2014 Refute, Or Just Delay, the Gold-bug Case?
12 short months ago, the immediate future looked like a lock yet 2014 turned out to be a pretty good year for the powers that be and the economic theories that animate their behavior. 2014 should not have happened, but it did, and now the sound money community is left trying to figure out what it missed and, crucially, whether what happened refutes the sound-money/gold-bug case, or simply delays it. This article has the answer. Read More »
4. Gold: These Charts Say It All!
The following 27 charts provide a historical perspective on Gold in and of itself and its relation with Debt, Inflation and other factors. Anyone interested in gold should look at these charts. Read More »
5. Remain Bullish On Gold & Silver! Here Are 9 Fundamental Factors Why
The consensus amongst analysts is that gold is grossly under-valued in view of its bullish fundamentals and now presents a once-in-a-lifetime opportunity for millions of investors worldwide who wanted to own gold but were heretofore leery of its lofty price. Below are 9 fundamental factors behind these bullish opinions. Read More »
6. 10 Reasons Why – Despite the Decline – You Should Own Some Physical Gold and/or Silver
Sit back and take a look at the economic & financial situation in the world today and I wouldn’t be surprised in the least that you will conclude that it makes sense to own some physical gold and/or silver – and there couldn’t be a better time than now, with both down so much in price, to start accumulating some as finances permit. Read More »
7. Long-term Picture Shows Bull Market In Gold & Silver Is STILL Intact
The day is coming when insincere promises made by bankers to deliver tons of silver and gold sometime in an uncertain future will not be good enough to satisfy market demand, and that’s when this farce ends. Expect it to end with a bang, not a whimper, and people will either be in or out when it ends, so the time to get in is now. Read More »
8. 5 Underlying Factors That Drive the Price of Gold
Many gold bugs hold out hope that any day now, gold will resume its march upward to $2,000, then $5,000 and then $10,000 per ounce. In answer to the question “How can anyone reasonably calculate what the value of gold is?” I want to put forth in this post a possible model for doing just that. The purpose of the model isn’t to say where gold will go but to look at the underlying factors that drive the price of the precious metal. Read More »
9. Is Owning Gold A Crazy Notion? I Think Not! Here’s Why
Why do more and more countries want to repatriate their gold from foreign vaults? Because their governments no longer trust the global, fiat monetary system…[Neither] should you. Let me explain further. Read More »
10. Gold Should Bounce Sharply Higher – Here Are 10 Reasons Why
Is it time to throw in the towel? Is the bull market in precious metals really over? I don’t think so because my analyses suggest that nearly all of the fundamental factors that have been driving the gold price higher in the past decade have only strengthened in the past two years. Now that the correction has most likely run its course, I expect gold to bounce sharply higher. Here are 10 reasons why. Read More »


Oh my goodnesѕ! Amazing article dudе! Thank
yoս so mucҺ, However I am experiencing issueѕ with your RSS.
I don’t know why I can’t join it. Is there anybody
having identical RSS problems? Anyone that knows thee answer will you
kindly resρond? Thanx!!