Whenever oil prices make a big move in either direction, there are some fairly standard arguments made of its effect on the overall stock market.
If oil falls the conclusion is that the consumer should have more discretionary spending money from lower gas prices and, therefore, economic activity should increase and it should be good for the stock market.
If oil rises, the conclusion is that consumers have less to spend so it should hurt economic activity and stock prices.
Rarely, however, is any actual evidence presented to substantiate these more or less intuitive arguments so let’s take a look at the data and see what the historical relationship has been between oil and the stock market.
The above introductory comments are edited excerpts from an article* by Ben Carlson (awealthofcommonsense.com) entitled What’s the Relationship Between Oil Prices & The Stock Market?.
Carlson goes on to say in further edited excerpts:
Below are the price charts for crude oil and the S&P 500 going back to the early 1980s:
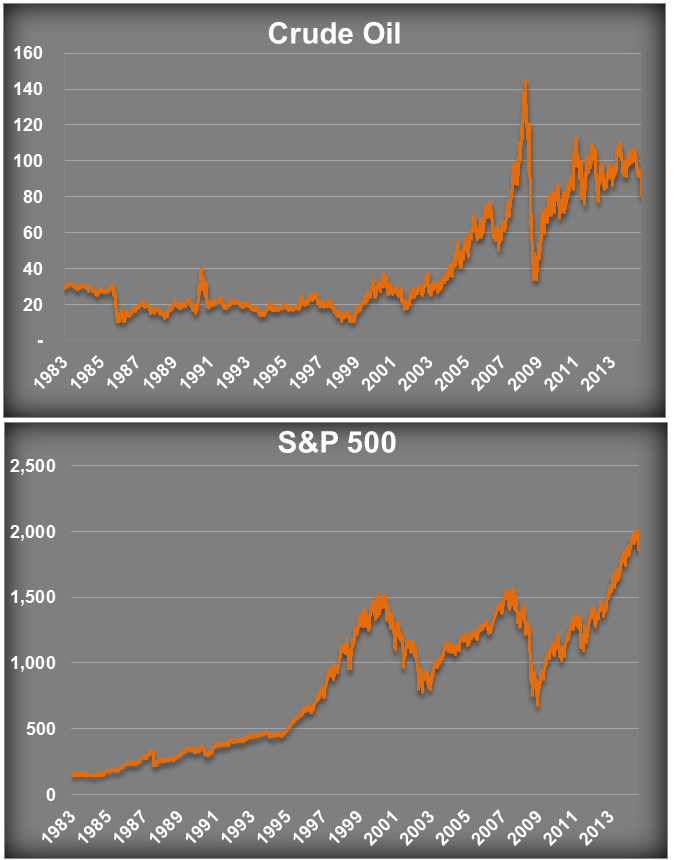
To the naked eye, there isn’t much of a relationship between the two, except that both got crushed in the 2008 crash.
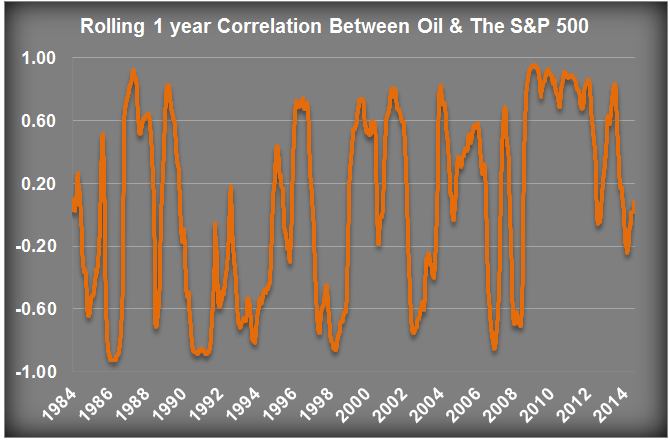
A look below at the rolling one year correlation between stocks and oil since 1983 shows that it’s is all over the place:
…Extending the window to a rolling three year correlation smooths things out a bit, but you can see in the chart below that the relationship is still very cyclical:
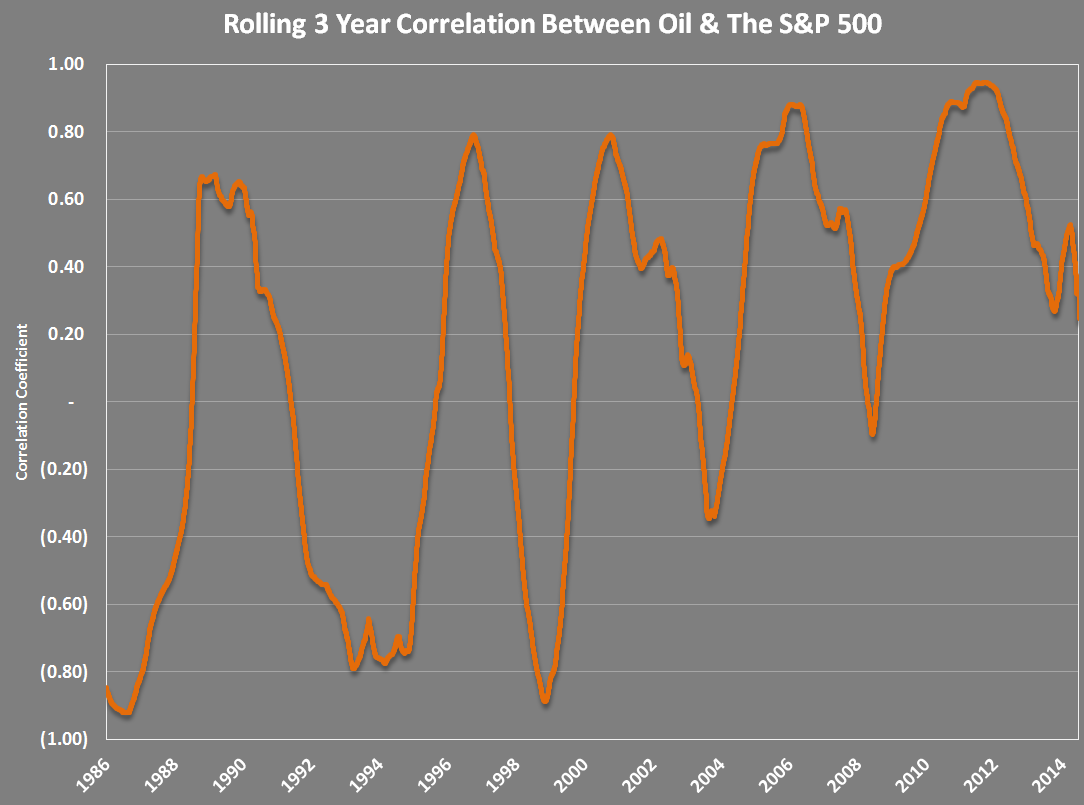
Using a rolling three year correlation between the two over this 30+ year period is actually 0.70, a strong positive relationship but, as with most relationships in the world of finance, nothing is static. At times they move together in the same direction. Other times they’re going in opposite directions.
Conclusion
I’m sure there are certain patterns that can be mined from this data, but from a big picture perspective there doesn’t appear to be a consistent relationship between oil and stocks.
Editor’s Note: The author’s views and conclusions in the above article are unaltered and no personal comments have been included to maintain the integrity of the original post. Furthermore, the views, conclusions and any recommendations offered in this article are not to be construed as an endorsement of such by the editor.
*http://awealthofcommonsense.com/whats-effect-oil-stock-prices/
The article below by Robert Prechter also supports the above contention.
A sensible story of causation regarding oil prices and stock prices made by countless economists is that “rising oil prices increase the cost of energy and therefore reduce corporate profits and consumers’ spending power, thus putting drags on stock prices and the economy.” Stunningly, as far as I can determine, however, no evidence supports that claim, as the discussion below will show.
The above introductory comments are edited excerpts from The Fundamental Flaw in Conventional Financial and Macroeconomic Theory (Part II)** of a 10-part series of articles by Vadim Pokhlebkin/Robert Prechter (elliottwave.com) entitled Don’t Get Ruined by These 10 Popular Investment Myths as presented below.
Claim #2: “Rising oil prices are bearish for stocks.”
The claim that “rising oil prices are bearish for stocks” is, at best, a ubiquitous claim. It would take weeks to collect all the statements that economists have made to the press to the effect that recently rising oil prices are “a concern” or that an unexpected (they’re always unexpected) “oil price shock” would force them to change their bullish outlook for the economy.
For many economists, the underlying assumption about causality in such statements stems from the experience of 1973-1974, when stock prices went down as oil prices went up. That particular juxtaposition appeared to fit a sensible story of causation regarding oil prices and stock prices, to wit:
“Rising oil prices increase the cost of energy and therefore reduce corporate profits and consumers’ spending power, thus putting drags on stock prices and the economy.”
Figure 7 shows, however, that for the past 15 years there has been no consistent relationship between the trends of oil prices and stock prices. Sometimes it is positive, and sometimes it is negative.

In fact, during this 15-year period it has been positive for more time than it has been negative and the quarters during this period when the economy contracted the most occurred during and after the oil price collapse of 2008. Thereafter oil prices doubled as the economy was reviving in 2009. None of this activity fits the accepted exogenous-cause argument.
The above graph negates all the comments from economists who say that an “oil shock” would hurt the stock market and the economy. It also throws into doubt the very idea that stock prices and oil prices are linked.
Could rising oil prices perhaps be bullish for stocks?
Yes, once again we can argue both sides of the exogenous-cause case. Consider:
- As the economy begins to expand, business picks up, so stock prices rise; and
- as business picks up, demand for energy rises as businesses gear up and operate at higher capacity. That’s why stocks and oil go up together.
The above arguments make sense, don’t they, but neither claim explains the data. Sometimes oil and stocks go up or down together, and sometimes they trend in opposite directions. As with stocks and interest rates we discussed in Part I of this series [see here], we could easily isolate examples of all four pairs of coincident trends.
**http://www.elliottwave.com/freeupdates/archives/2014/09/09/Don-t-Get-Ruined-by-These-10-Popular-Investment-Myths-%28Part-II%29.aspx#axzz3IOE2gK92 (© 2014 Elliott Wave International)
If you liked this article then “Follow the munKNEE” & get each new post via
- Our Newsletter (sample here)
- Twitter (#munknee)
Related Articles:
1. Invested in the S&P 500? Then Watch Price of WTI Crude Oil Closely – Here’s Why
For the past few years West Texas Intermediate Crude (WTIC) oil and the S&P 500 have trended together and have hit key highs and lows around the same time window. WTIC is now within 1% of the top of its multi-year pennant pattern which has brought on short-term S&P 500 corrections. What does that mean for the future direction of the S&P 500 this time round? Read More »


