Many people are saying that our national debt – which now exceeds $17 trillion and is growing by more than $1 trillion per year – is a disaster just waiting to happen. Right? Well, not exactly. Let me put things into perspective:
Even though federal debt has soared relative to GDP in the past decade, the burden of the debt is about as low as it’s ever been. Still, the growth in debt does reflect some structural problems that are working to keep the economy from achieving its full potential.
1. Federal Debt Held By the Public
Chart #1 below shows the swelling size of our national debt, which is correctly measured as the amount of Treasury debt that is held by the public, and that now stands at $17.16 trillion. Too often I see people saying the national debt is over $23 trillion, but that figure is inflated, since it includes some $6 trillion which the government owes to itself (i.e., excess revenues that the social security administration has “lent” to the Treasury). You can see the current figures here.
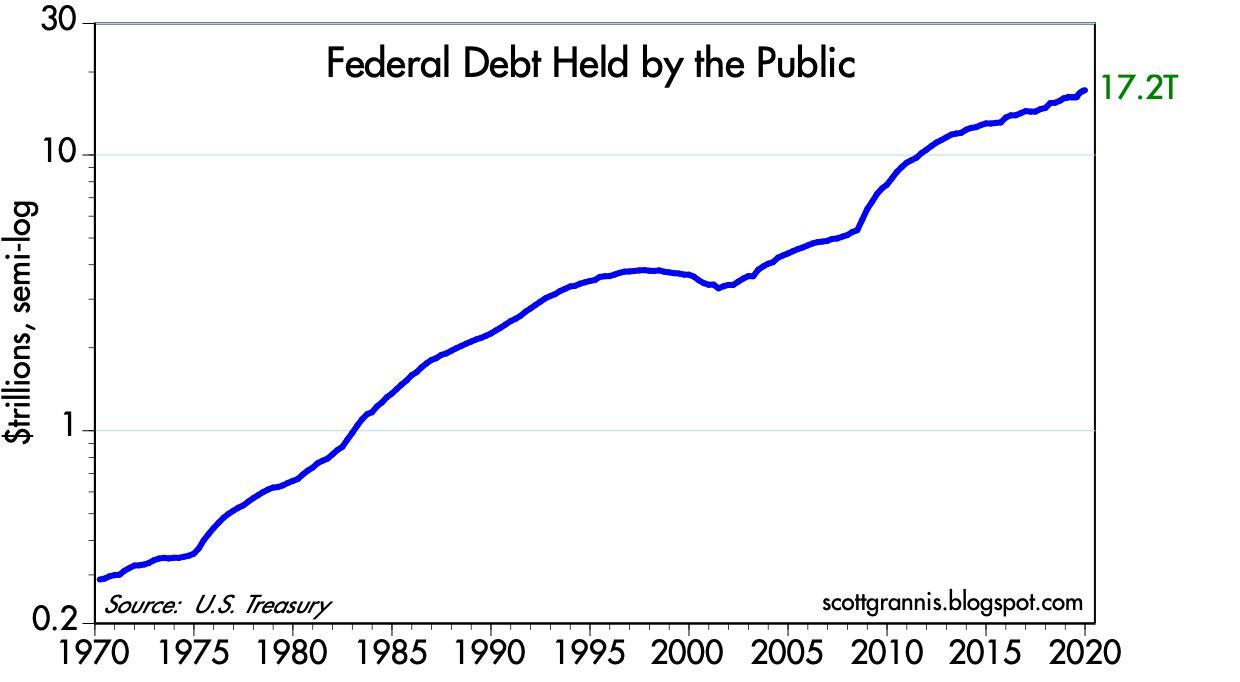
The above chart #1 uses a semi-log scale for the y-axis, so that means that a constant slope is equal to a constant rate of growth in nominal terms. Note that:
- the slope of the line for the past 7-8 years has been flat (i.e., the growth rate has been constant) and that
- the slope was steeper in the mid-’80s and in the 2008-2012 period. Federal debt is growing, but not nearly as fast as it was growing in other times.
2. Federal Debt vs. Interest Rates
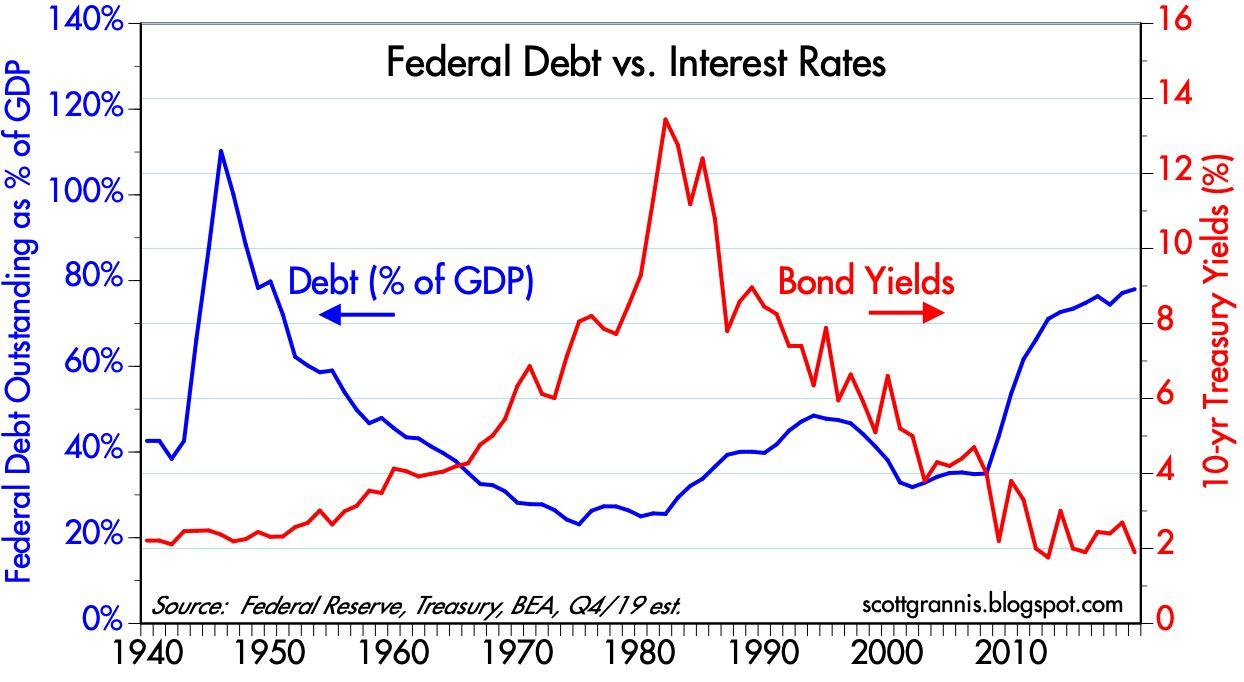
It’s common to hear people argue that with so much debt being issued, interest rates will inevitably have to rise but, as Chart #2 below shows,
- the size of the debt (when measured relative to the size of the economy, which is essential, since a bigger economy can support a bigger debt load, just as households can with rising incomes) has tended to move in a very counter-intuitive fashion with respect to interest rates.
- Slower growth in debt tends to coincide with rising interest rates and
- faster growth in debt tends to coincide with falling interest rates…
3. Interest Rates on Federal Debt As a % of GDP
The true burden of the national debt is not the amount we owe but the ratio of interest payments on the debt relative to our national income (GDP) as Chart #3 below demonstrates.
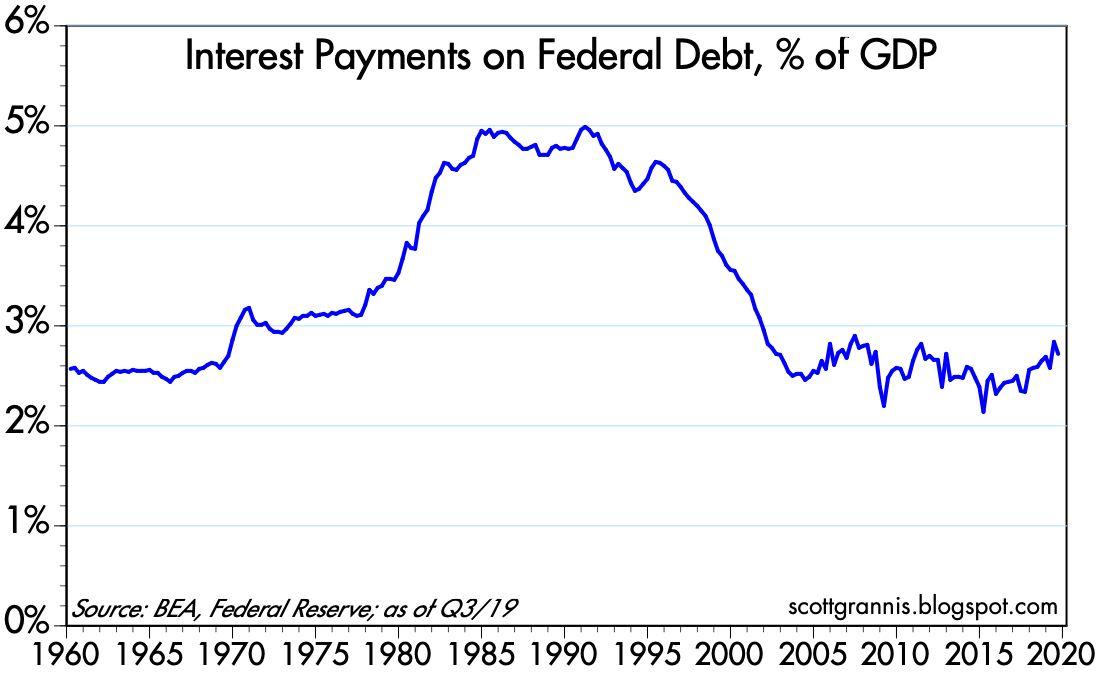
Because interest rates are at historically low levels, the current burden of our national debt is about as low as it has ever been, even though the debt has soared to 78% of GDP.
4. U.S. Household Financial Burdens
Households’ debt burdens (Chart #4 below) are also about as low as they have ever been.

Everyone benefits from lower rates, but in addition, households have eschewed debt while embracing the safety of Treasuries.
- Total household liabilities have only increased by 11% since their peak in 2008, according to the Fed.
- Households now hold over $2 trillion of federal debt, up hugely from $300 billion in 2008.
- Most of the rest is held by corporate and institutional investors, sovereigns, and foreign investors in general. China alone holds some $2 trillion of Treasury debt.
- Treasury yields are low because the demand for Treasuries is strong.
5. Federal Government Finances
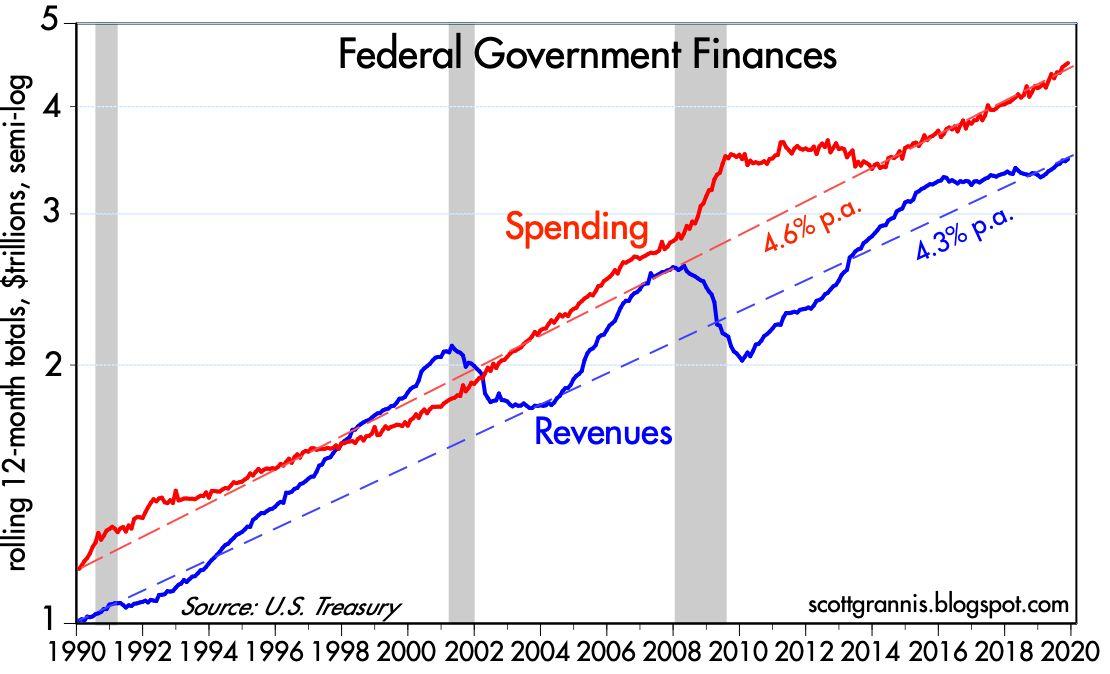
Chart #5 below shows why we have come to have a $17 trillion debt. It’s simple: government spending has exceeded revenues for just about forever.
Note:
- how revenues pick up during recoveries. A stronger economy creates jobs, rising incomes, and rising tax payments.
- how revenues reliably weaken during recessions and one reason for the apparent shortfall in revenues – which began at least a year before Trump’s tax cuts – is that the past decade has seen the weakest growth of any expansion in history.
- Tax receipts thus have a strong cyclical component.
6. Federal Transfer Payments As a % of Federal Spending
Spending, on the other hand, is driven largely by transfer payments (Medicare, Medicaid, Social Security and income security), which now constitute about 70% of all federal spending (see Chart #6 below).
![]()
…No amount of budget cutting is going to make more than a modest dent to federal spending. The elephant in the spending living room is transfer payments, which are paid out according to people’s “eligibility” and not according to any Congressional budget appropriations. To control spending will require that Congress change the eligibility formulas for things like Social Security and Medicare.
7. Federal Spending & Revenues as a % of GDP
Chart #7 below shows federal spending and revenues as a % of GDP. Here we see that the trends are relatively flat, and the current levels of spending and revenues are not greatly different from what they have averaged since WW II.
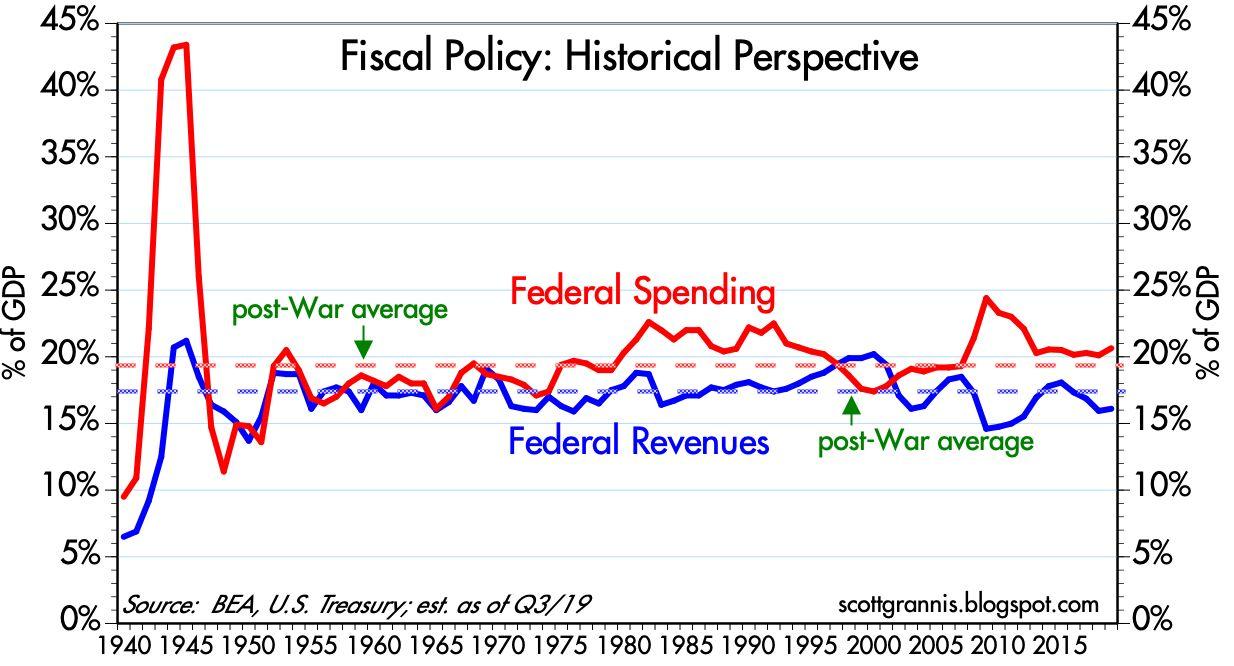
Revenues do look a bit weak currently, but this is most likely due to the fact that economic growth in the current expansion has been sub-par (2.2% vs. a long-term average of about 3.1%).
- Revenues haven’t picked up much in the current recovery because it has been a weak recovery and because tax rates were cut modestly for individuals and significantly for corporations in 2017.
- Revenues weakened at least a year before Trump’s tax cuts took effect, and in the past year, revenues have been rising at more than a 4% rate.
- Corporate tax revenues plunged in 2017 and 2018, as expected, but in the first 11 months of 2019, they are up over 10% from the same period in 2018.
- The Trump tax cuts were a one-time event which was expected to result in much lower corporate revenues initially, to be followed by rising revenues in years to come as overseas profits are repatriated and increased business investment (of which there are few signs to date, unfortunately) results in rising profits in the future…
It’s not crazy to think that much of the federal government’s debt has been used unproductively, and this is one reason why our economy’s growth rate over the past decade has been sub-par…
- If the government hadn’t borrowed all that money, it might have been used more efficiently by the private sector.
- Efficient investment, of course, boosts jobs, incomes, and overall prosperity.
- Inefficient investment leads to stagnation.
8. Real Yields vs.Real GDP Growth
Nominal and real interest rates are unusually low, which means that the bond market does not yet expect to see accelerating economic growth. In fact, as Chart #8 below suggests, the market seems priced to a further slowdown in growth; real interest rates on 5-year TIPS moved into negative territory this week for the first time since April 2017.

Things To Watch For Going Forward
- Real interest rates on TIPS are key barometers of the bond market’s expectations for economic growth in the years ahead. If they rise, this would be a good sign.
- Swap spreads are key indicators of the health of financial markets and leading indicators of economic health; right now, they are very low and that is very good. Any rise above 30-35 bps on 2-year swap spreads would be a flashing yellow light.
- Credit spreads on corporate debt are key indicators of the market’s confidence in the outlook for corporate profits; currently they, are relatively low and that is good.
- Commodity prices have been relatively low, but recently they show signs of perking up; if this continues, that could be an indicator that the global economic outlook is improving.
- The residential construction has been in a period of consolidation in the past year or so, but recently appears to be picking up, and that is good.
- Any slowdown in the growth of bank savings deposits would be a good sign that risk aversion is declining and optimism is rising, and that would be very good.
What Will Happen Going Forward?
- If the economy picks up steam, and if tariff wars begin to unwind, then money demand should decline, caution should recede, and interest rates should, therefore, rise.
- At the same time, a stronger economy would likely result in a further pickup in revenues, a smaller deficit, and slower growth in federal debt so rising interest rates should go hand in hand with slower growth in total debt even as the burden of debt would tend to rise because of higher interest rates.
This is not a recipe for disaster – it’s a rosy scenario that we should dearly hope develops!
Looking Ahead
I’m optimistic that the economy will continue to grow. I don’t see a risk of recession, nor do I see any significant acceleration…