Enjoy the good times while you can because when the economy BLOWS UP this next time, there is no plan B. Sure, we could see massive monetary printing by Central Banks to continue the madness a bit longer after the market crashes, but this won’t be a long-term solution. Rather, the U.S. and global economies will contract to a level we have never experienced before. We are most certainly in unchartered territory… the GRAND FACADE will come crashing down to the shock and surprise of the masses. Here is my analysis and the reasons why we are heading towards a cliff.
 The original article has been edited for length (…) and clarity ([ ]) by munKNEE.com to provide a fast & easy read. For all the latest – and best – financial articles sign up (in the top right corner) for your free bi-weekly Market Intelligence Report newsletter (see sample here) or visit our Facebook page.
While the mainstream media and financial networks suggest that THIS TIME IS DIFFERENT for the markets, it isn’t. The fundamentals of the markets are so out-of-whack, I am amazed people can’t see it.
NYSE Margin Debt
Let’s first look at the NYSE margin debt. According to the chart by the Advisor Perspectives, the New York Stock Exchange margin debt is at new record high:
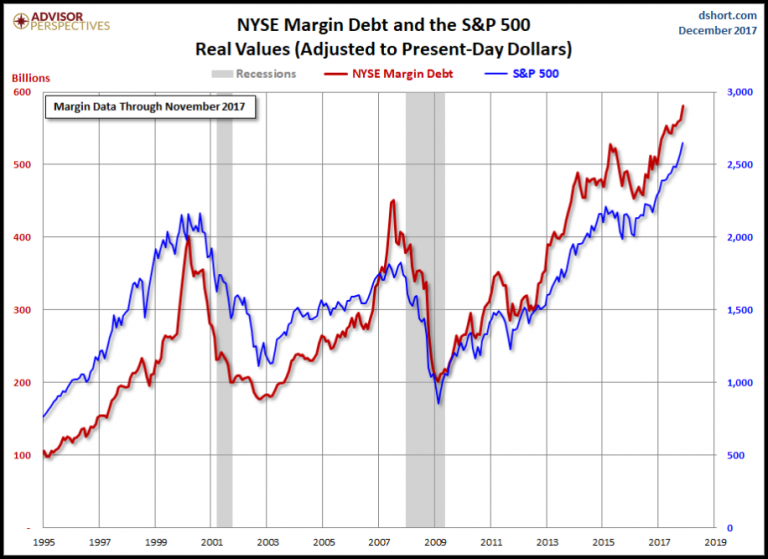
As we can see [in the graph above], the NYSE margin debt (by traders) is nearly $600 billion versus $400 billion in 1999 and $450 billion in 2007 which means the NYSE margin debt is 33% higher than the level it was right before the 2008 U.S. Housing and Banking collapse.
If we look at the 1999 and 2007 NYSE margin debt graph lines (RED), we can spot a huge spike right before they both peaked. If this is the way it will happen in the current trend, then we will likely see a huge spike and stock market MELT-UP before it peaks and collapses, you know, the last chance for the really stupid traders to get SUCKED in.
VIX Index
As the NYSE margin debt reaches new record territory, so has the VIX Index and the stock market. Yesterday, the VIX Index (measures volatility in the markets) closed at a new record low of “9”, while the Dow Jones Index ended the day at a record high of 24,922 points:
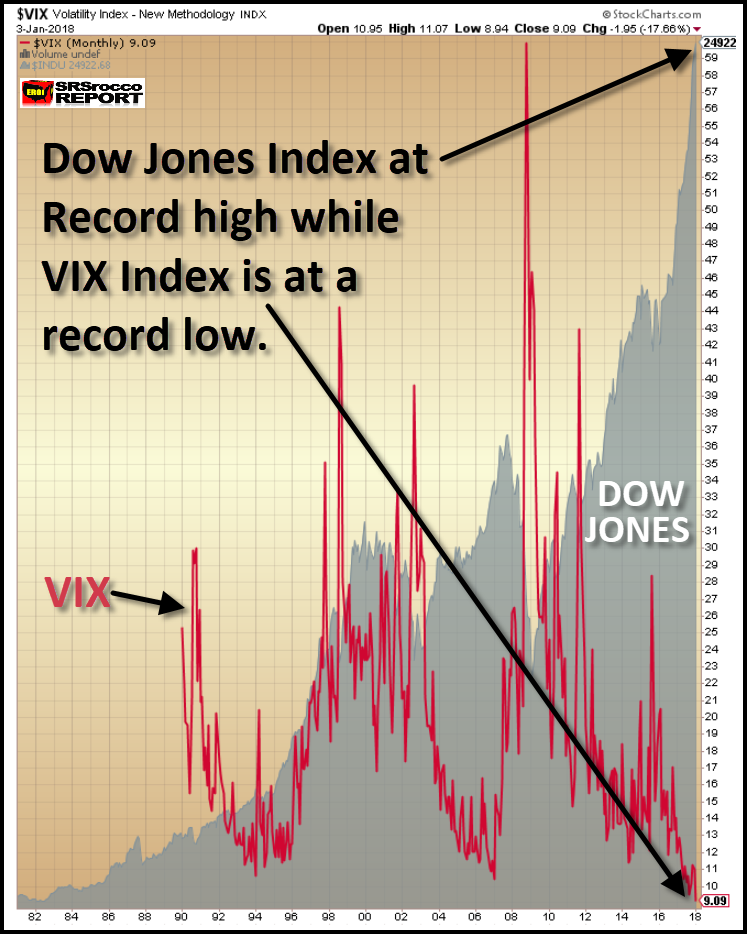
Today, the Dow Jones Index has reached another record at 25,100. Just like the cryptocurrency market, the only direction is HIGHER. Who knows how low the VIX Index will go and how high the Dow Jones will reach, but my gut tells me that this will be the year that the fun finally ends.
Retirement Market
Of course, if we have new record highs in the stock markets, we should see the same with the U.S. Retirement Market:
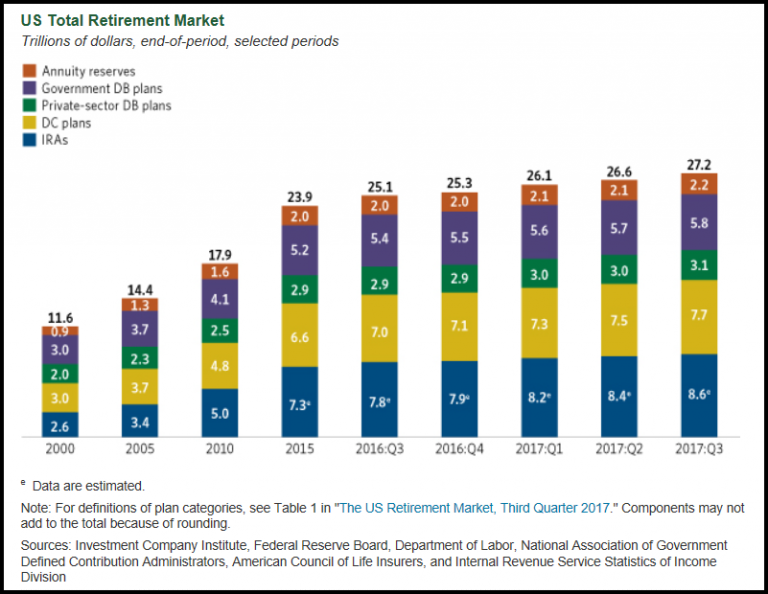
According to the ICI – Investment Company Institute, the U.S. Retirement Market hit a new record at $27.2 trillion in the third quarter of 2017. I would imagine the U.S. Retirement Market will surpass the $28 trillion mark in 2018.
When Americans feel rich via their investments, it makes them also feel good about buying more crap they don’t really need or can afford. You see, frugality has been totally erased from Americans’ mindset… If frugality were reintroduced to Americans, then the entire economy would collapse overnight. Why? Because, the U.S. economic model is based on buying as much as we can on debt and credit. If we moved back to being frugal or buying only with cash, then 95-98% of the U.S. economy would disintegrate…
The value of stocks, bonds, and real estate have been wildly inflated due to Central Bank money printing and the tremendous increase in debt. If an individual stayed awake during their economic classes in high school or college, NET WORTH comes from subtracting DEBTS from ASSETS. However, today, we don’t worry about the debts. We only look at the assets. This is like eating all the junk food during the holidays and not worrying about the way it comes out the other end.
Americans have deluded themselves into believing that [the] crap that is put on our dinner plate is good for us so why should we blame them if they forget about debts and only look at assets? It makes perfect sense when LIES and FRAUDULENT activity are the predominant ideology in society.
Commercial Short Positions On Oil
If we look at the current oil price chart, it seems as if it is heading back towards $65 (200-month moving average–BLUE LINE) and then up to $100:
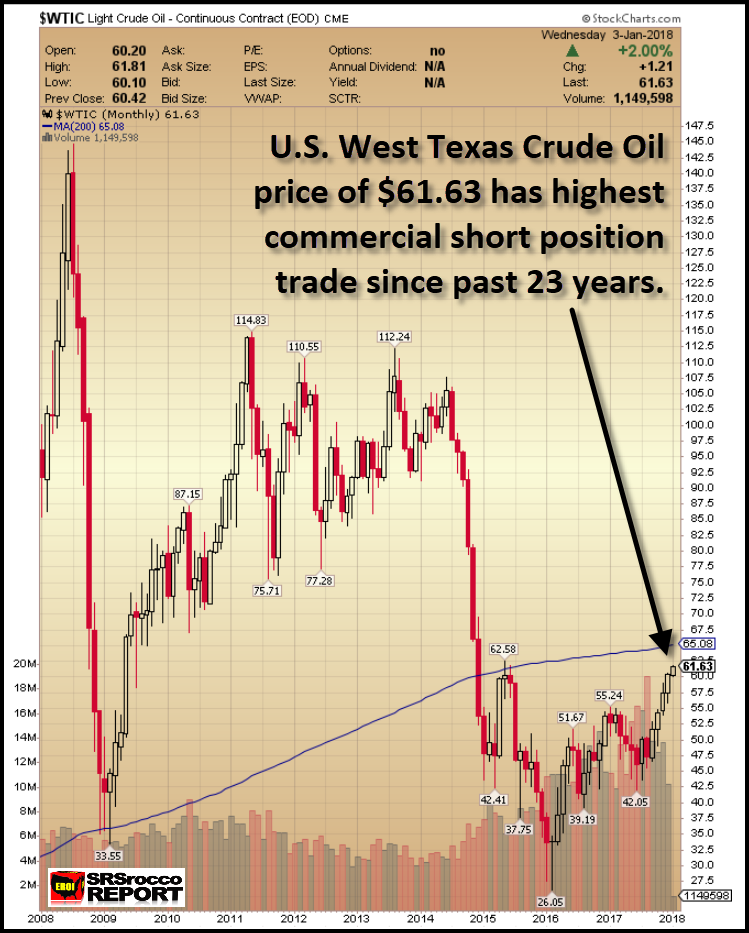
However, the COT Report (Commitment of Traders) shows a much different setup. The amount of commercial short positions in the oil market is the highest going back 23 years. Furthermore, the current 644,000 commercial short positions are even higher right before the price fell from $105 in 2014:
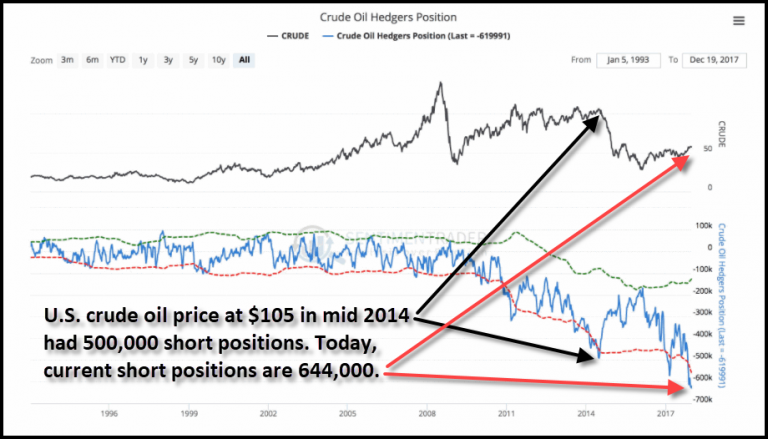
You will notice when the price of oil was at $105 in 2014, the commercial shorts (hedgers positions) were approximately 500,000 contracts. Today at $62, the current commercial short positions are 644,000 (the chart above is two weeks old). Furthermore, when the price of oil fell from $105 down to a low of $26 at the beginning of 2016, the commercial short positions fell to a low of 180,000 contacts so, it looks like the oil price is being set up for one hell of a fall.
The Price Of West Texas Crude Oil
Now, the interesting part of the equation is this; will the oil price fall when the markets crack, or before? Regardless, if we look at all the indicators (VIX Index record low, Stock Market Record High, NYSE margin debt record high or commercial short positions on oil at a record high), we can plainly see that the LEVERAGE is getting out of hand. These indicators and others give me the impression that the economy and markets are going to BLOW UP in 2018.
Moreover, this setup already took place in the market back in 1987 as seen in the chart below…from 1984-1988…
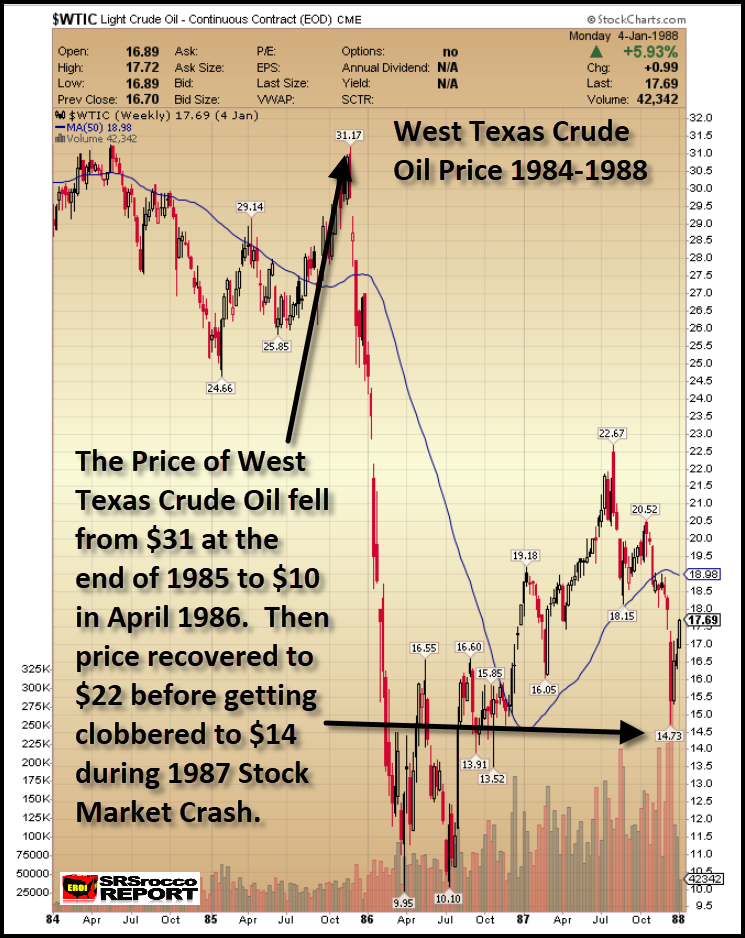
- The decline in the price of oil from $31 to $10 was quite similar to what happened in 2014 when the price fell from $105 to a low of $26 in 2016.
- Also, the oil price recovery in both periods was quite similar as well. From July 1986 to August 1987 and from January 2016 to January 2018, the oil price (and economy) recovered. The oil price more than doubled from its low in 1986 ($10-$22) and 2016 ($26 to $62).
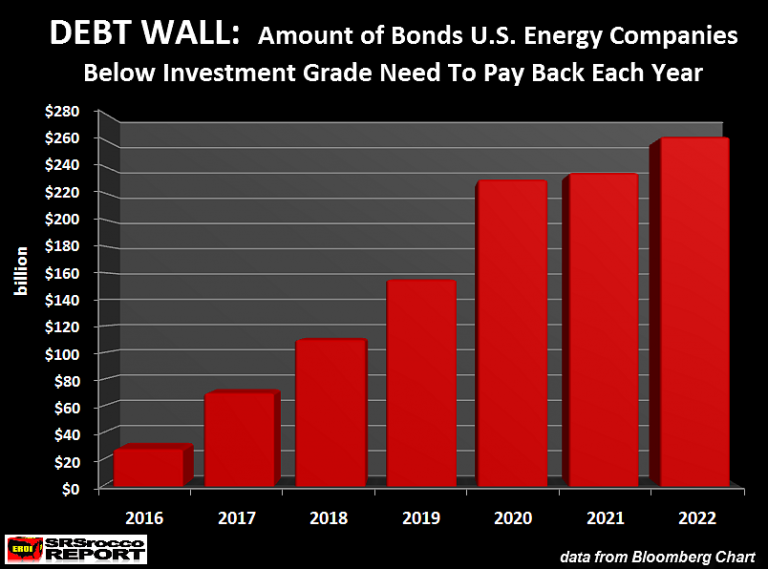
Either way, the indicators are pointing to one hell of a deleveraging of the markets. Investors need to understand when the oil price heads south once again; it will likely be the death-knell for the already weak U.S. Shale Oil Industry. We must remember, when the markets were collapsing in 2008, the U.S. oil industry was still in relatively good shape. Today, most of the shale companies have debt up to their eyeballs. Once again, here is the chart of the coming ENERGY DEBT WALL:
…To tell you the truth, when the markets finally crack, and the real carnage rips through the U.S. economy, we only have ourselves to blame. There are no pointing fingers when we are all involved…
Conclusion
In conclusion, the U.S. and world economies are heading towards one heck of a crash. What happens when this occurs, it’s anyone’s guess. Likely, the Central Banks will step in with their magic and print money like crazy. However, this is not a long-term solution. If you haven’t bought some physical gold and silver insurance yet and are waiting to time the markets, GOOD LUCK WITH THAT…
[button color=”red” size=”small” link=”http://” ]Scroll to very bottom of page & add your comments on this article. We want to share what you have to say![/button]