This post focuses on TIPS prices, gold prices, and P/E ratios, and  attempts to deduce what they tell us about the assumptions embedded in the market.
By Scott Grannis (scottgrannis.blogspot.ca)
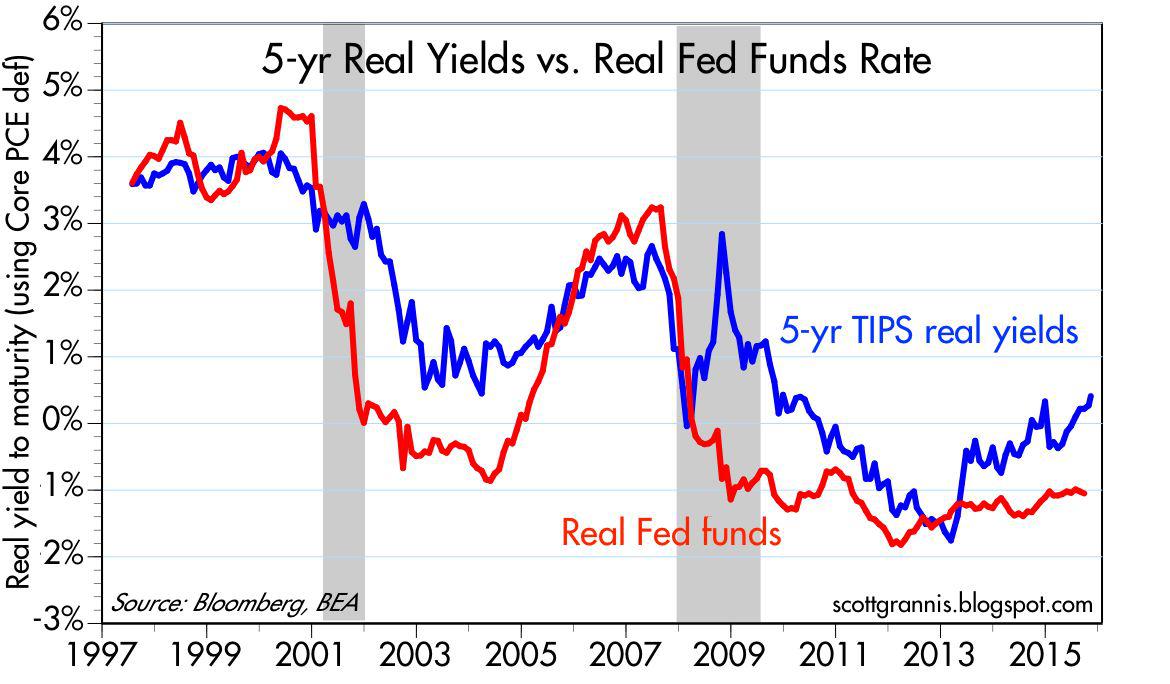
The chart above compares real yields on 5-year TIPS with the real Fed funds rate.
For one, this tells us that the real yield curve today is positively sloped (i.e., short-term real rates are lower than medium-term real rates), and that, in turn, means that the market expects the Fed to tighten monetary policy going forward. Real yields on 5-year TIPS today (0.4%) can be thought of as the market’s expectation for the average real yield on Fed funds (currently about -1%) over the next 5 years. This condition must hold in a market equilibrium, leaving investors indifferent between investing overnight or for 5 years.
(click to enlarge)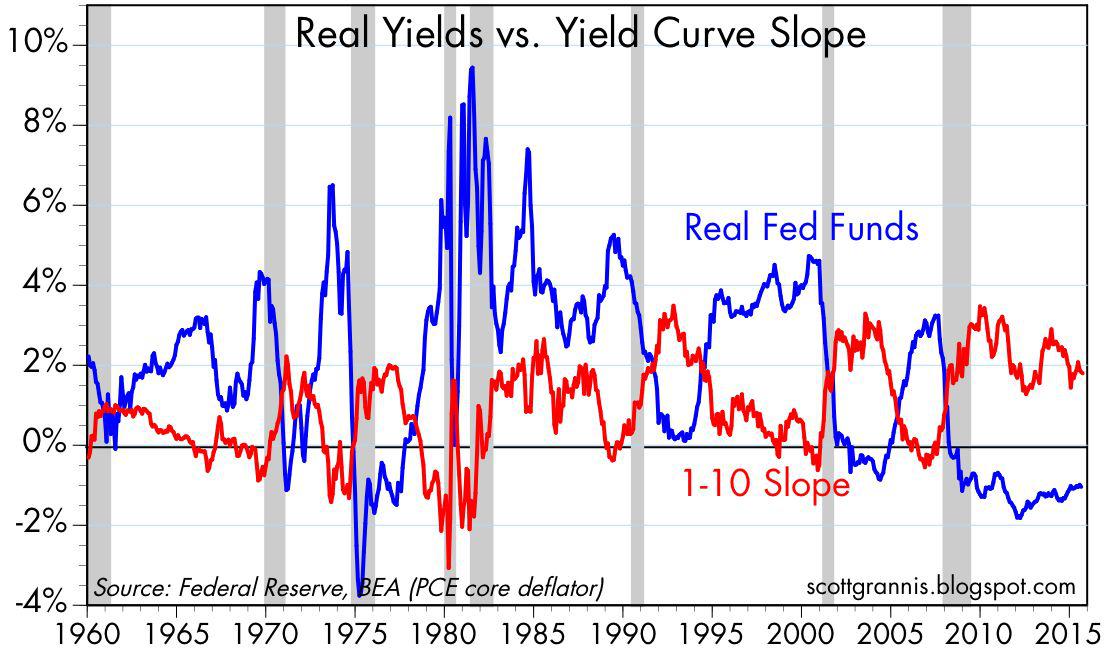
The chart above compares the real yield on Fed funds to the slope of the nominal yield curve.
Note that the yield curve is typically positively sloped in the early stages of a business cycle recovery, but it becomes negatively sloped in the latter stages. Why? Because inflation has typically picked up as the business cycle matures, and the Fed typically uses tighter money policy (which takes the form of higher real yields) in order to “cool off” the expansion and suppress inflation pressures. Every recession in the past 50 years has been preceded by a significant rise in real short-term yields. The shape of the yield curve today and the low level of real yields tell us that we are probably years away from another recession, because the market doesn’t expect any aggressive tightening from the Fed for many years.
(click to enlarge)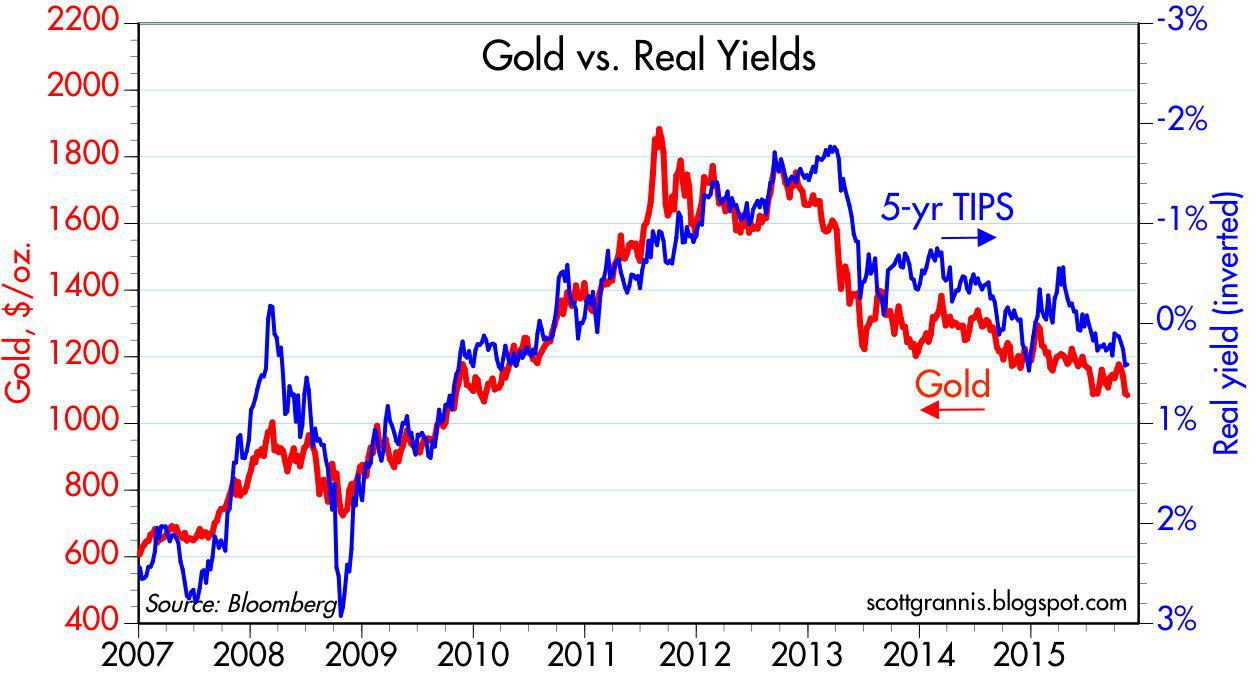
The chart above compares the inverse of real yields on 5-year TIPS (using that as a proxy for their price) to the price of gold.
It’s rather remarkable that the two have tracked each other so well for the past 8 years, since these two assets share almost nothing in common. The one thing they do share, however, is that they are both considered to be safe-haven assets. Gold is the favored port in any economic or financial storm, while 5-year TIPS are not only risk-free, but also inflation-protected so the fact that they are moving together suggests that what is acting on these two prices is the market’s degree of risk aversion. Risk aversion was high – and demand for TIPS and gold was strong – a few years ago, when gold hit $1900/oz. and real yields fell to close to -2%.
Today, we see less risk aversion, because the prices of gold and TIPS have fallen but both are still well above their long-term averages. The market, therefore, seems to be transitioning from a period of high risk aversion to lower risk aversion (as a corollary, we could say that optimism was in very short supply a few years ago, and is now beginning to return) but we are still far from a market which is “irrationally exuberant.”…
(click to enlarge)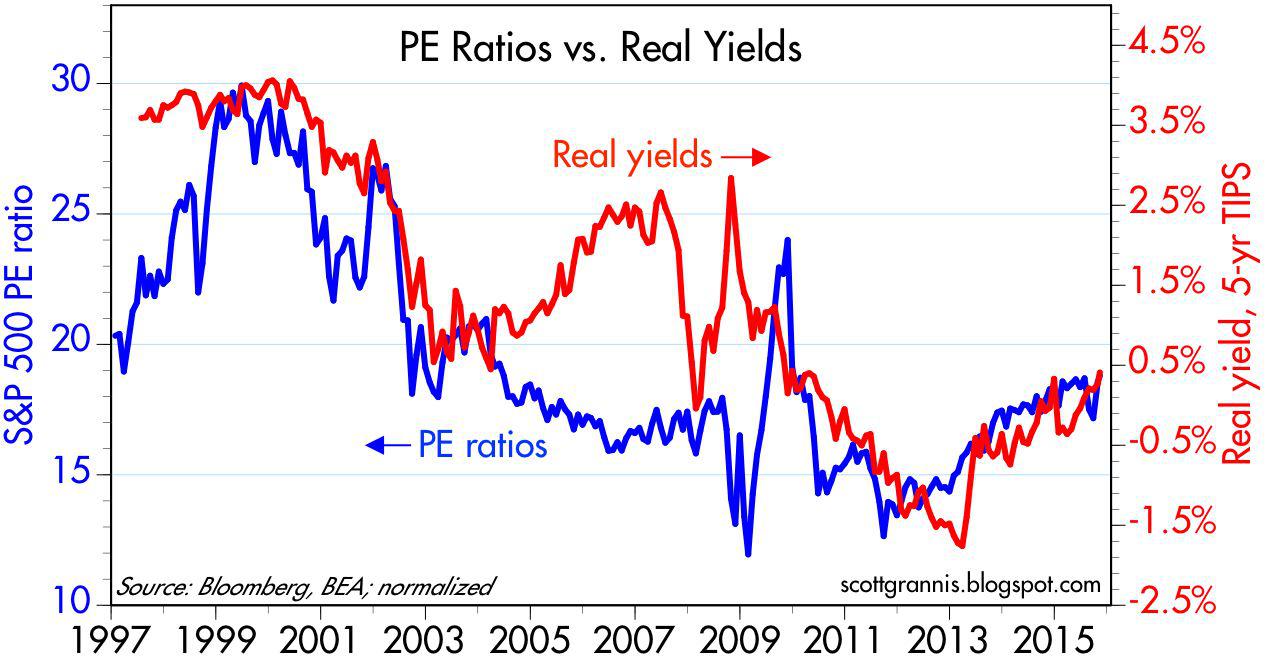
The chart above compares real yields on 5-year TIPS to the P/E ratio of the S&P 500 (as calculated by Bloomberg).
Here, again, we see an interesting correlation (with the exception of the 2004-2007 period…[during] which the Fed was aggressively tightening monetary policy) which involves forcing real short-term interest rates higher.
When the Fed is not forcibly intervening in the market, real yields show a strong tendency to track P/E ratios…We know that rising P/E ratios tend to correlate to a rising tolerance for risk and increased optimism about the future of the economy. Investors are willing to pay more for a dollar’s worth of earnings when they believe the economy – and profits – are likely to improve. Today, P/E ratios of 18-19 are only slightly above their long-term average. This confirms the message of gold and TIPS, which is that the market is transitioning from being very afraid to becoming cautiously confident. Valuations, in other words, are somewhere between cheap and expensive but there’s nothing big to worry or get excited about. The economy is growing at a subpar 2-3% rate, the market is cautiously optimistic, and the Fed is about to begin raising short-term rates in a very gradual fashion…
We’ve been in a subpar recovery for years now, thanks mainly to very high marginal tax rates, excessive regulatory burdens, and policy uncertainty…
The market seems to have fully priced all this in so buy stocks if you think the policy environment is going to improve, and sell stocks if you think the policy environment is going to get worse…
[The original article* was written by Scott Grannis (scottgrannis.blogspot.ca) and is presented by the editorial team of munKNEE.com (Your Key to Making Money!) and the FREE Market Intelligence Report newsletter (see sample here – register here) in a slightly edited ([ ]) and abridged (…) format to provide a fast and easy read.]*http://scottgrannis.blogspot.ca/2015/11/the-message-of-tips-gold-and-pe-ratios.html