Historically, the performance of the S&P 500 Index relative to the U.S. Dollar Index has been a good indicator of bull and bear markets but it has underperformed the Dollar Index since mid-2014. It’s an ugly warning sign for the market. I see the stock market moving downward from here.
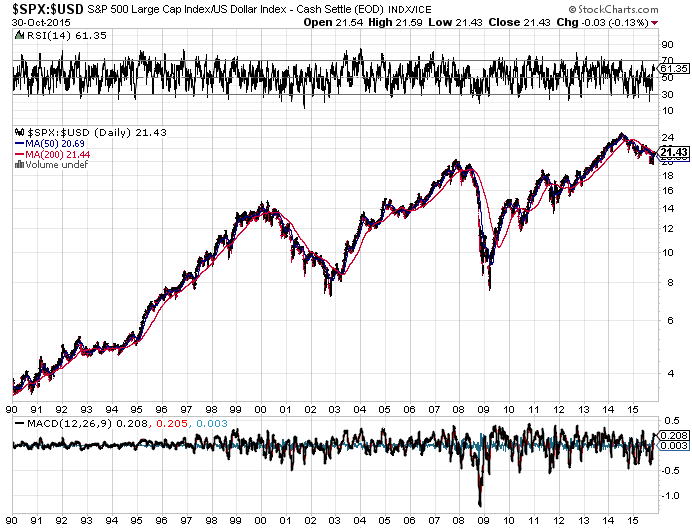
Historically, the performance of the S&P 500 Index relative to the US Dollar Index has been a good indicator of bull and bear markets. This relationship is expressed in a ratio – the value of the S&P 500 index divided by the value of the U.S. Dollar Index:
- In bull markets, the S&P 500/US Dollar Index ratio moves upward, the 200-day moving average slopes upward, and the ratio is above the 200-day moving average.
- In bear markets, the ratio moves downward, the 200-day moving average slopes downward, and the ratio is below the 200-day moving average.
Typically this ratio stalls out about a year in advance of a looming bear market: see 1999 and mid-2007. And in mid-2014, over a year ago, it stalled out again….
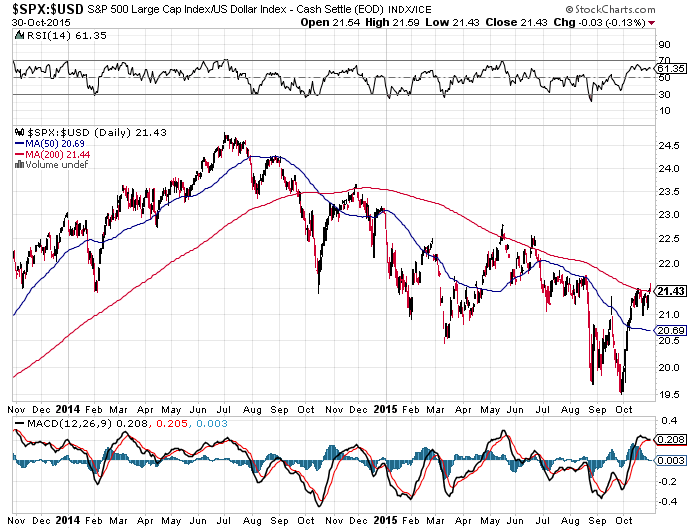
By this historical standard, this indicator turned bearish in 2014 and has stayed that way ever since: The ratio has been moving downward since July 2014, it has been below the 200-day moving average since September 2014, and the 200-day moving average has been sloping downward since December 2014.
The ratio has repeatedly tested the 200-day moving average and been rejected: at the end of November 2014, in May 2015 at the stock market’s peak, again in June 2015, and just now in October 2015:
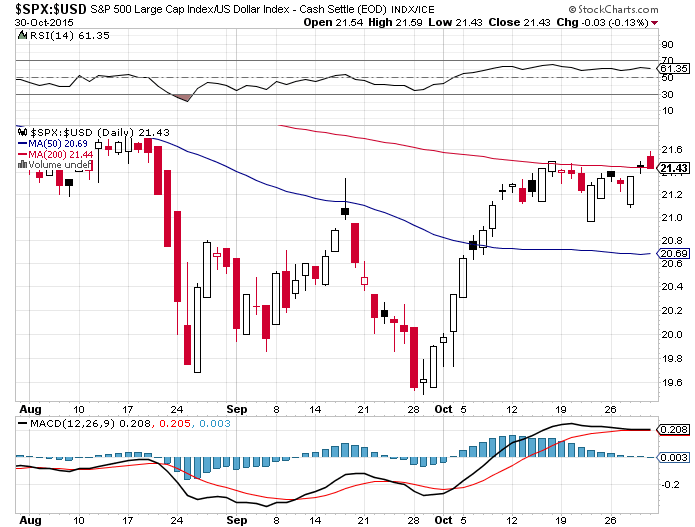
Looking up close at just the most recent October rally, the ratio touched the 200-day moving average on October 16, backed away, touched again October 29, and fell right back under the 200-day moving average at the close on Friday, October 30:
Looking at the big picture, the stock market has been steadily declining relative to the dollar for the past 16 months. Such a trend has never occurred during a bull market in at least the past 25 years. In fact, looking at the historical chart above, one sees the ratio stalled out in 1999, a year before the 2000 crash, and the ratio stalled out again in 2007, a year before the 2008 crash. To me, all of this indicates we are already in a bear market now.
Looking at the short-term trend, in the current rally the S&P 500 / Dollar Index ratio has not even broken above the 200-day trend line as much as it did in May and June.
The S&P’s underperformance of the Dollar Index since mid-2014 is an ugly warning sign for the market. I see the stock market moving downward from here.
[The above article*, written by Geoffrey Caveney, originally appeared on wolfstreet.com and is presented above by the editorial team of munKNEE.com (Your Key to Making Money!) and the FREE Market Intelligence Report newsletter (see sample here – register here) in a slightly edited ([ ]) and abridged (…) format to provide a fast and easy read.]*http://wolfstreet.com/2015/10/31/sp-500us-dollar-index-ratio-warns-october-rally-will-fail-bear-market-is-here/