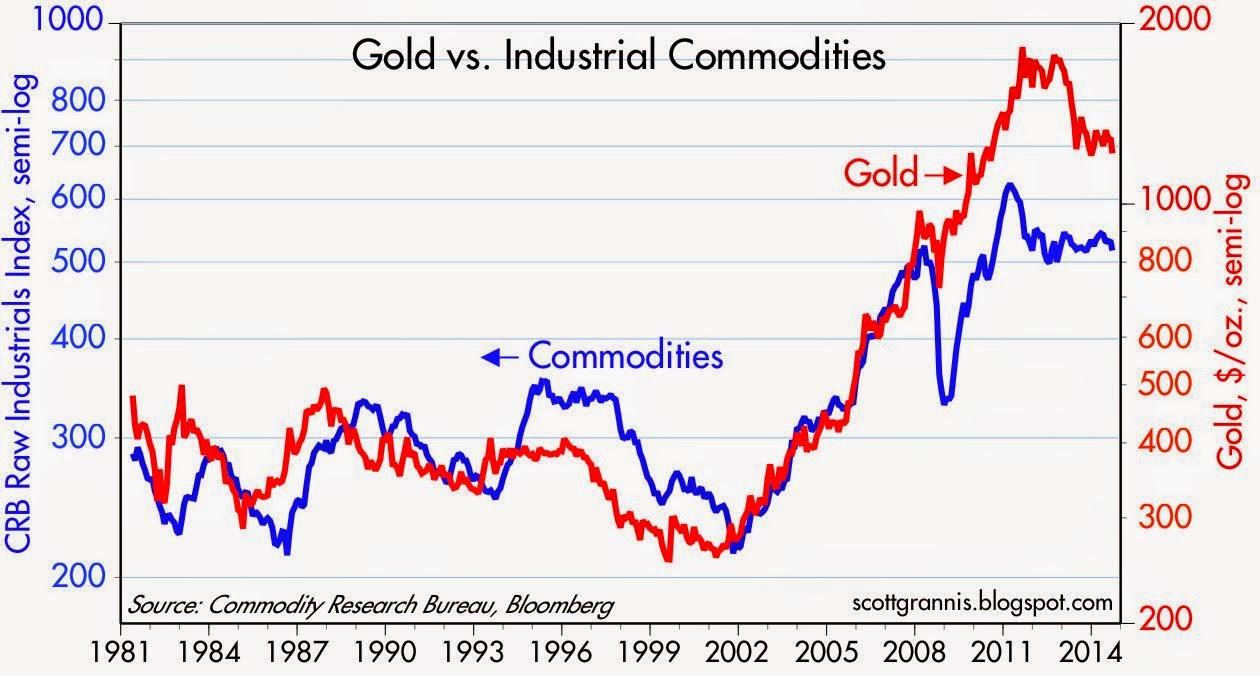
This article suggests that the Australian and Canadian dollars, and the British pound Sterling, can expect to decline significantly relative to the U.S. dollar in the months ahead and gold to decline even further relative to industrial commodity prices. Here’s why.
The above introductory comments are edited excerpts from an article* by Scott Grannis (scottgrannis.blogspot.ca) entitled The return of King Dollar.
Grannis goes on to say in further edited excerpts:
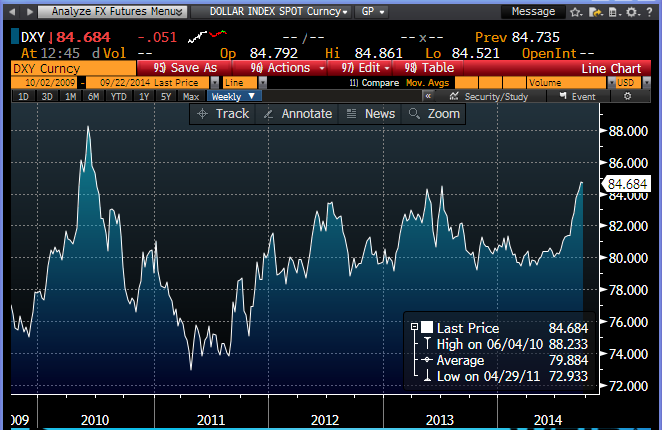
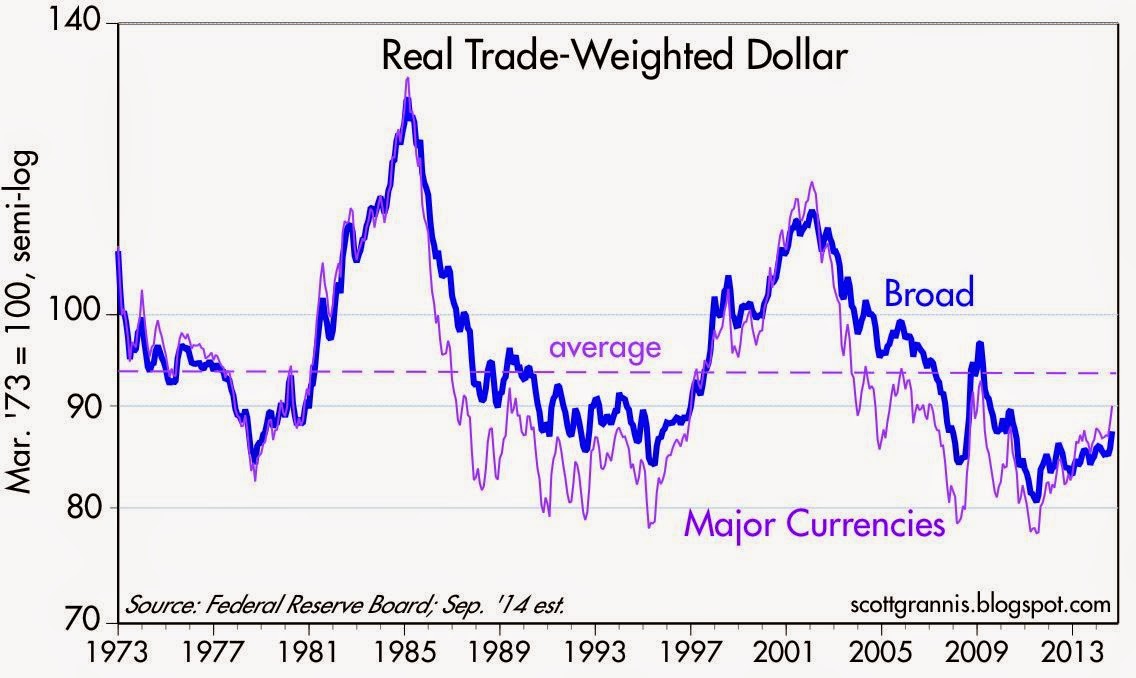
- Relative to its all-time high of May, 1985, when the economy was booming and the Fed was fighting inflation with sky-high interest rates, the dollar today is almost 30% weaker.
- Relative to the early 2000s, when the economy and equity markets were booming and the Fed was fighting the specter of rising inflation, the dollar today is about 20% weaker.
 RBC Capital Markets]
U.S. Dollar’s Strength & Weakness Relative to 5 Major Currencies
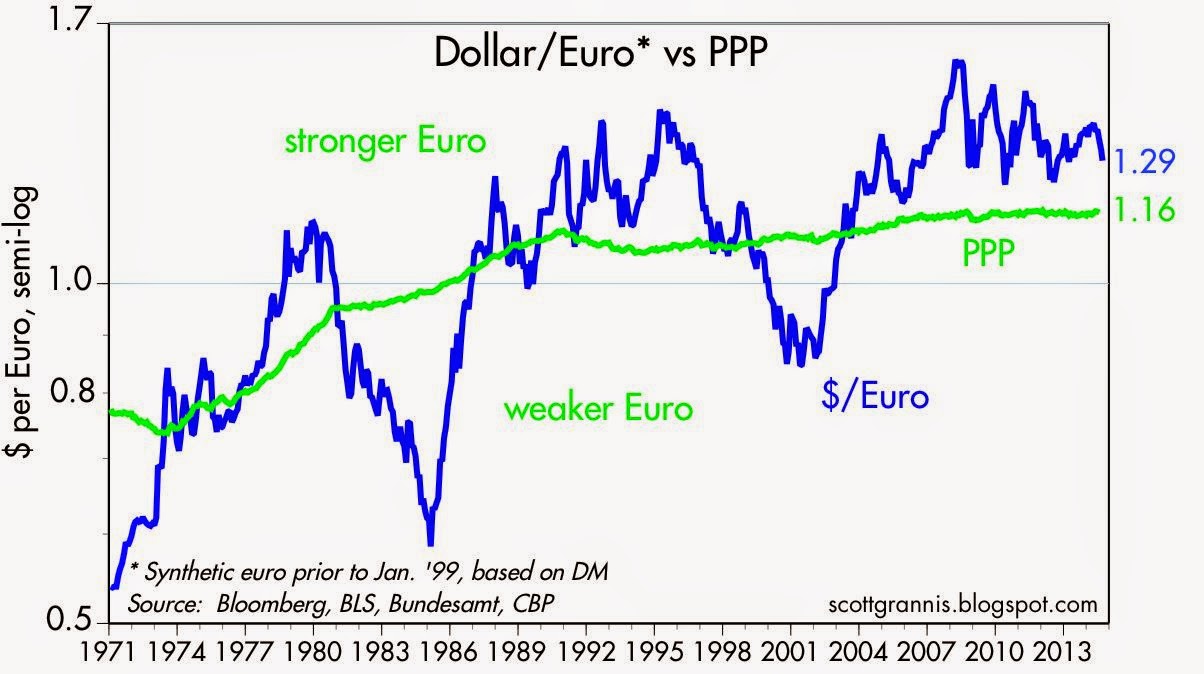
The yen’s relentless appreciation over the previous 40 years made life very difficult for Japanese industry, for example, since they had to continually cut their costs to remain competitive with overseas manufactures. Now that the yen is closing in on its PPP value relative to the dollar, and the Abe administration is pursuing more growth-oriented fiscal policies, it’s become very good news for the Japanese economy and for the world.


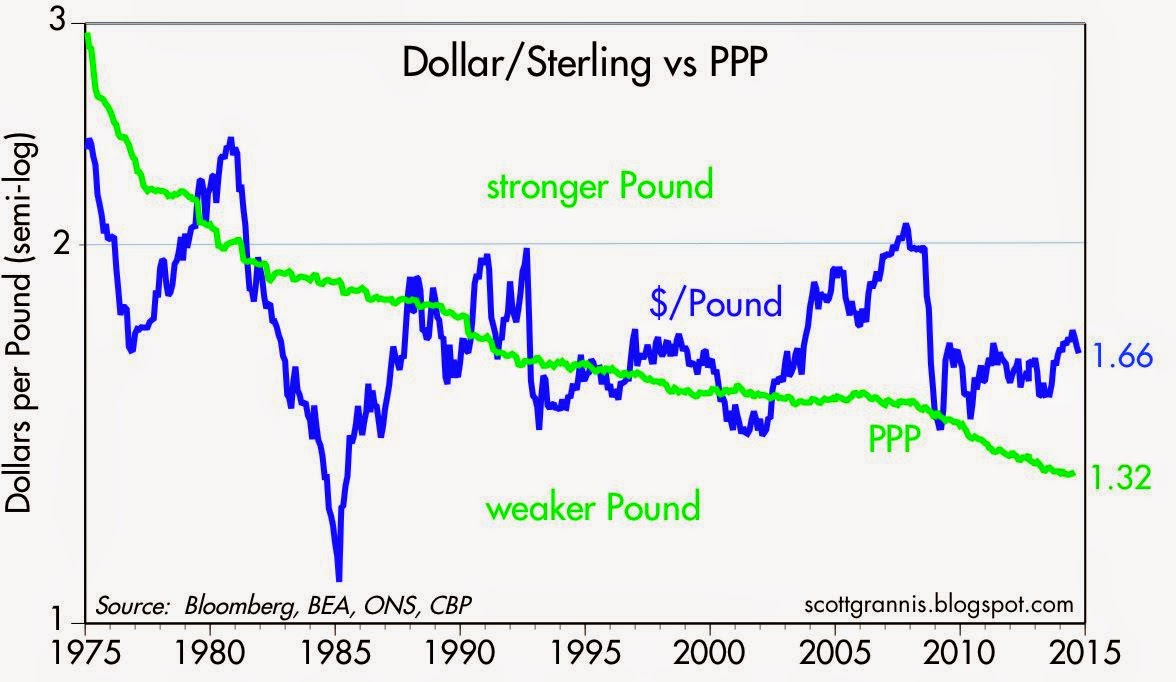
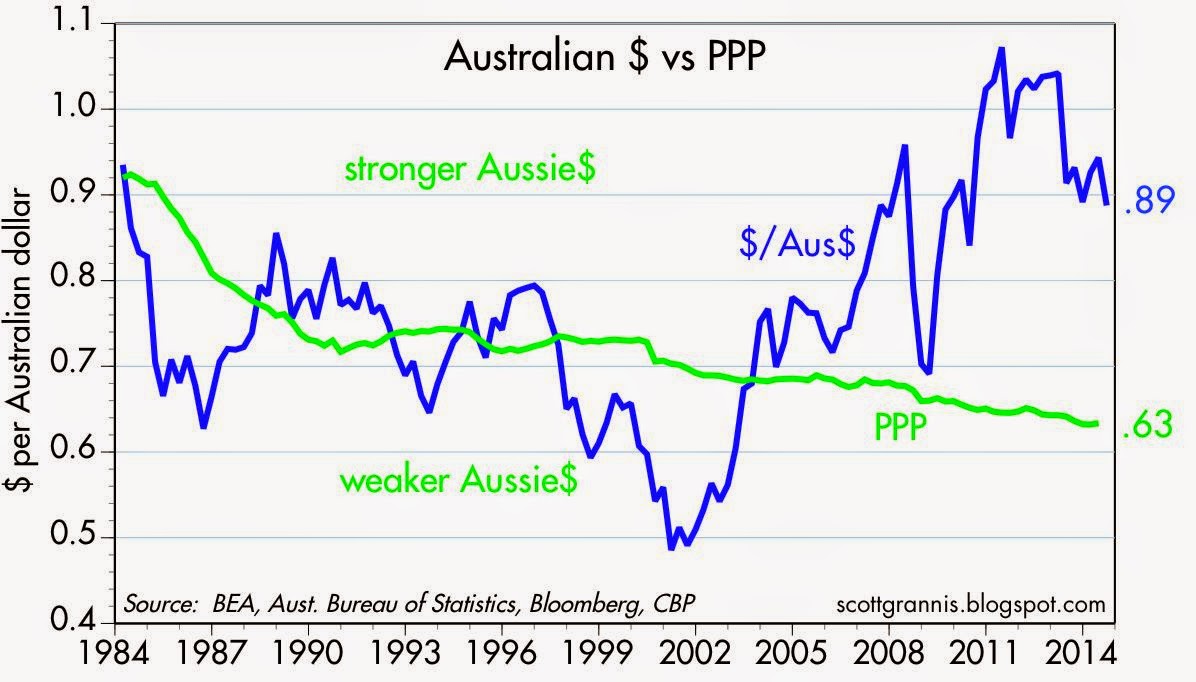
Since the Australian economy is heavily dependent on commodity exports, the Aussie dollar has tended to move with commodity prices. It too peaked against the dollar in 2011, and since then it has dropped almost 20% relative to the U.S. dollar. By my calculations, the Aussie dollar is still about 40% “overvalued” against the U.S. dollar, making Australia a rather expensive vacation destination for U.S. tourists (and, by the same logic, the U.S. offers very inexpensive vacations for Australian tourists.)
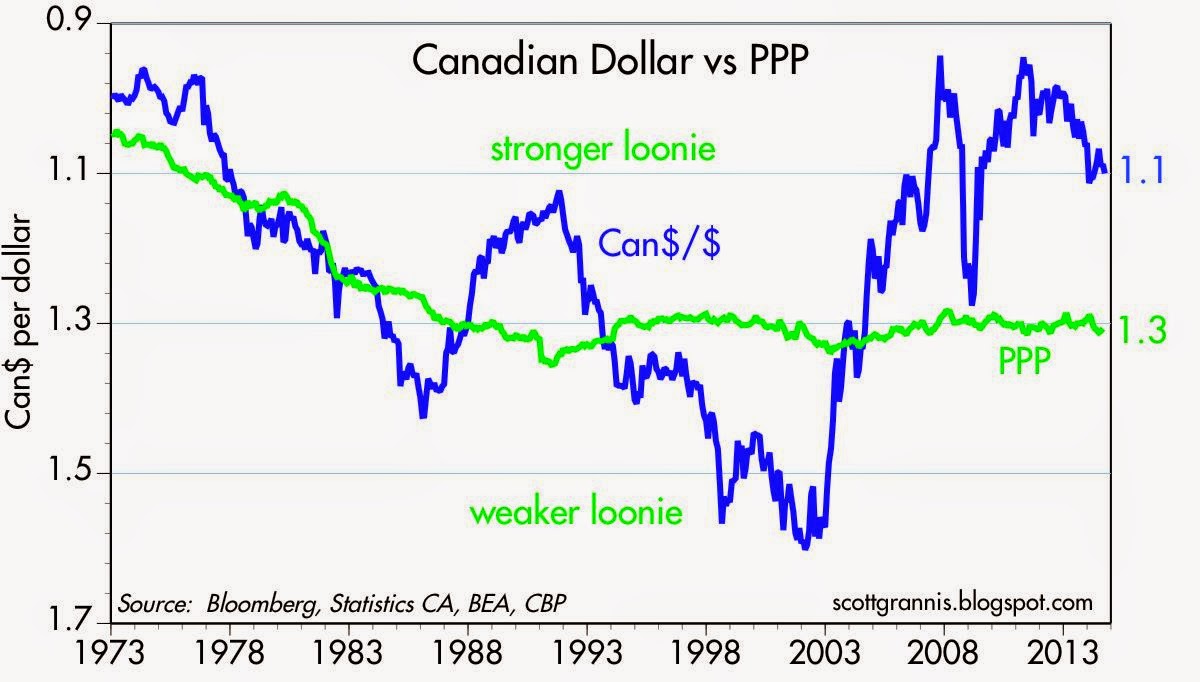
The story is quite similar for the Canadian dollar, since Canada is also dependent on commodities, although not as much as Australia. I figure the “loonie” is still almost 20% “overvalued” against the U.S. dollar. As the chart above shows, Canadian inflation has been almost identical to U.S. inflation over the past 20 years, which makes it likely that eventually the “loonie” will weaken further against the U.S. dollar.
- fears that the Fed’s QE efforts would debase the dollar and lead to higher inflation;
- fears that trillion-dollar federal budget deficits would prove to be the norm and that in turn would lead to a significant rise in U.S. tax burdens;
- fears that an onerous increase in regulatory burdens under Obamacare and Dodd-Frank would weigh on the economy; and
- fears that the U.S. economy was vulnerable to a double-dip recession.
We’ve still got lots of problems to deal with (and the dollar is still weak), but we now know that:
- the Fed hasn’t (yet) made a big inflation mistake, and is on the verge of ending QE and beginning to normalize short-term interest rates,
- the federal budget deficit has fallen by two-thirds and is currently quite manageable,
- the debate over entitlement spending, which holds the key to the long-run budget outlook, is now centered around when and by how much spending can be cut, not whether. The ongoing failure of Obamacare and the long list of bureaucratic scandals in recent years have convinced a majority of the people that we suffer from too much, not too little government. Too much government killed Greece, and it’s killing Venezuela and Argentina as we speak and, finally,
- the U.S. economy has managed to grow by a relatively steady 2% pace for the past five years, and has been able to grow despite pronounced weakness in the Eurozone and a significant slowdown in the Chinese economy.
In short, things have turned out much better than the market feared. Looking ahead, it’s now pretty clear that:
- the Fed is going to pursue tighter monetary policy than the ECB, the BoE, and the BoJ,
- interest rate differentials are moving in favor of the U.S. dollar (i.e., U.S. short-term rates are rising relative to overseas rates) in anticipation of this,
- and that has also helped boost the U.S. dollar, as the chart below shows.

Even though the U.S. economy is saddled with:
- a very uncompetitive tax system,
- a hugely burdensome regulatory environment, and
- an abysmally low labor force participation rate,
it’s doing better than most other countries. In short, things haven’t turned out nearly as bad as the market feared.
Investment implications
- U.S. investments look attractive relative to non-dollar investments.
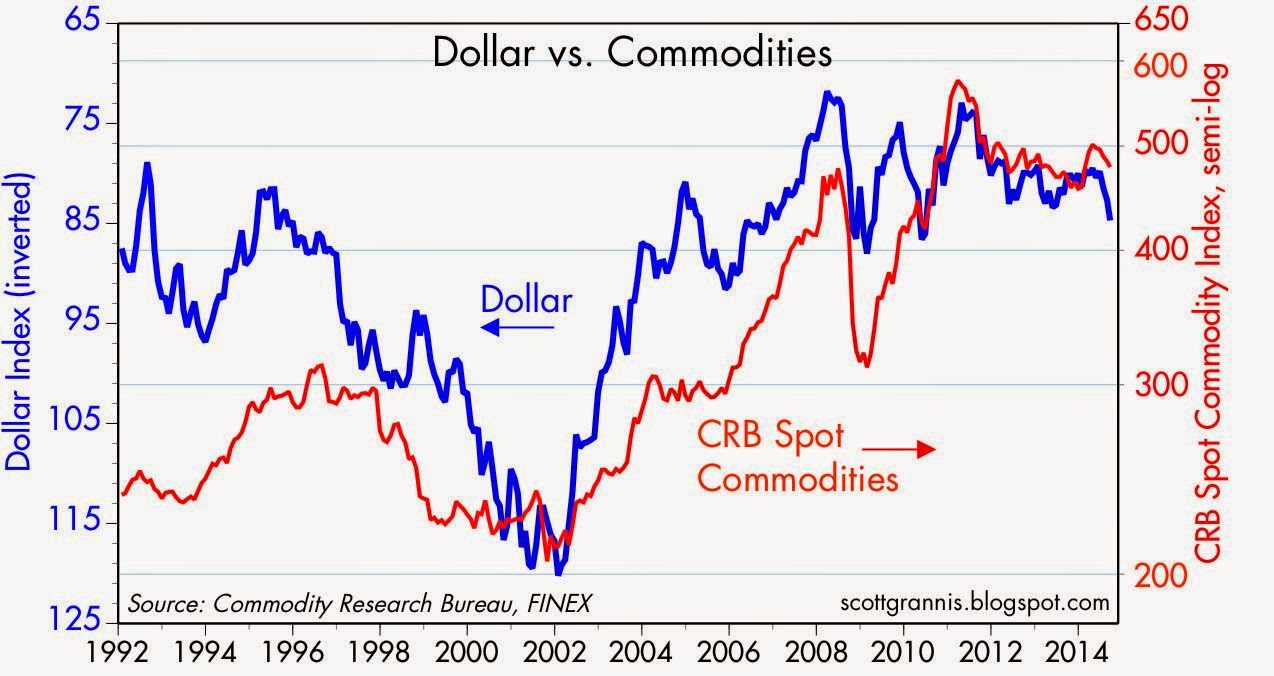
- Commodity prices are likely to weaken further if the U.S. dollar continues to strengthen.
This is unlikely to be bad news for emerging market economies, however, because:
- the dollar will be strengthening, and
- interest rates will be rising, as the outlook for the U.S. economy improves. (A stronger dollar that results from overt and aggressive Fed tightening can be very bad news for emerging markets, since it presages a sharp slowdown in the U.S. economy—that was the case in the early 2000s. Every recession in the past 50 years has followed a period of very tight monetary policy, as evidenced by high real interest rates and a flat or inverted yield curve. We’re years away from that.)
Summary
Editor’s Note: The author’s views and conclusions in the above article are unaltered and no personal comments have been included to maintain the integrity of the original post. Furthermore, the views, conclusions and any recommendations offered in this article are not to be construed as an endorsement of such by the editor.
If you liked this article then “Follow the munKNEE” & get each new post via
- Our Newsletter (sample here)
- Twitter (#munknee)
1. Don’t Buy Gold Until Price Falls Below $1100! Here’s Why
An analysis of the ratio between the market capitalization of gold and the gross world product over the past 63 years suggests that the current price for gold has further to fall and that it would not be wise to begin buying gold until prices have fallen below at least $1100 – and not expect gold to appreciate beyond $2,000 any time soon. Here’s why. Read More »
2. Noonan on Gold & Silver: “The Market Is ‘Speaking’ & THIS Is What the Charts Are Saying”
This is one of those times where it is best to focus on pictures of the market, over various time frames, to get a better handle on what to expect moving forward, and a look at the charts tells us in no uncertain terms that the end is not yet in sight. Here is our read of what the market is saying, and has been saying for some time. Read More »
3. Gold Price Is Falling For This Totally Logical Reason
Despite continuing QE and huge government deficits the price of gold has fallen 35% since its peak in 2011 and is down over 10% from its highs this year. Is there a logical explanation for this?I think there is. Read on. Read More »
4. The Gold Price Could Go Even Lower – Here Are 5 Reasons Why
I see various signs that indicate that gold bulls may have to endure one more capitulation to the downside before the next leg of the bull market begins. In what follows I identify what could send the gold price lower and suggest some investment strategies to consider. Read More »
5. Gold Will Drop to $900 – Silver to $15 – Before Going Parabolic!
Back in early May, 2013, I correctly forecast the lows in gold & silver which occurred 2 months later. Today, my new analyses indicates they both will show further weakness before both jumping dramatically in price by the end of 2014. Below are the specific details of my forecasts (with charts) to help you reap substantial financial rewards should you wish to avail yourself of my insightful analyses. Read More »
6. Final “thud” In Gold to $1,190 Level Coming! Here’s Why
In spite of the June 2014 pop [I expect to see]…a dip to below the $1190/oz level at some point between now and the end of the month. Here’s why. Read More »
7. Gold Price Dependent on Extent of Money Supply NOT Direction of US Dollar Index – Here’s Why
…When the USD starts to rise many assume that this is negative for paper gold ETFs such as GLD as well as physical gold. I’m sure you have heard it before, if the USD goes up then gold goes down, and vice versa…but, in reality, this “rule of thumb” isn’t the case and, in actuality, it would be impossible for the USD and gold to trade inversely with each other. Let me explain. Read More »
8. What Are Factors That Motivate Gold Saying Today?
What happens when gold has transitions from a cyclical bull market to a cyclical bear market? what motivates gold to enter a bull market phase? This article has the answers. Read More »
9. Decline In Gold Due to Stupidity, Greed & Stubbornness!
It never ceases to amaze me just how dumb and misinformed financial commentators are, often looking in all the wrong places for script, when the fact is that stupidity, greed, and stubbornness runs rampant amongst paper market gold speculators. Read More »
10. What Do Current Low Interest Rates Mean For the Future Price of Gold?
Investors commonly assume that rising interest rates adversely impact the gold price, and vice versa. They believe that a rising interest rate environment is indicative of a strong economy, which is supposed to drive investors out of gold and into the stock market. They further assume that investors will want to exchange their gold, which has no yield, for stocks and bonds, both of which have yields and generate income but this intuition is unfounded. Let me explain why that is the case ans why, as such, gold investors shouldn’t fear rising interest rates. Read More »


Great article. We have noticed the same info.