…We firmly believe that the precious metal prices will rise explosively from the current correction level till 2020…[and] will far outperform the DOW and related equity markets based on Fourier cycle analysis.
An article (original) by Dr. F.T. Dao which has been slightly edited ([ ]) and abridged (…) to provide a faster and easier read.
Generational Bull And Bear Markets
[As noted in the chart below]…every generation (20years), hard assets (represented by gold & silver) alternate with paper assets (represented by the DOW) in the rhythm of rise and fall in price.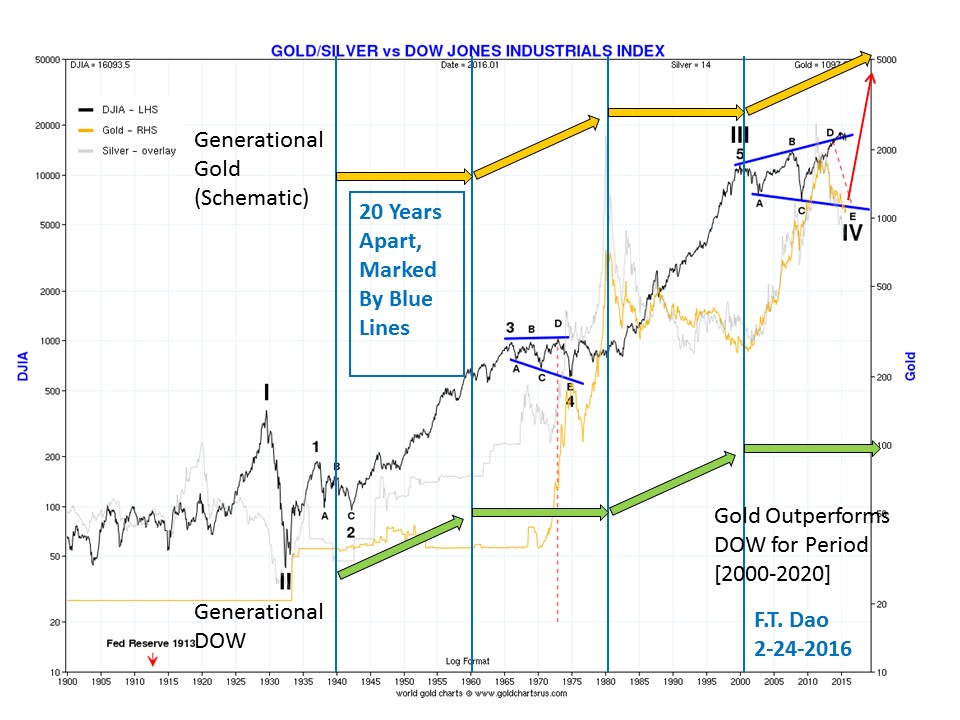
The current gold and silver [bull] markets began in 2000…have just completed corrections and are starting to rise again. Meanwhile, the Dow has been oscillating since 2000 and is now in the process of dropping down for the 3rd time.
Review of Gold, Silver and Gold Stocks
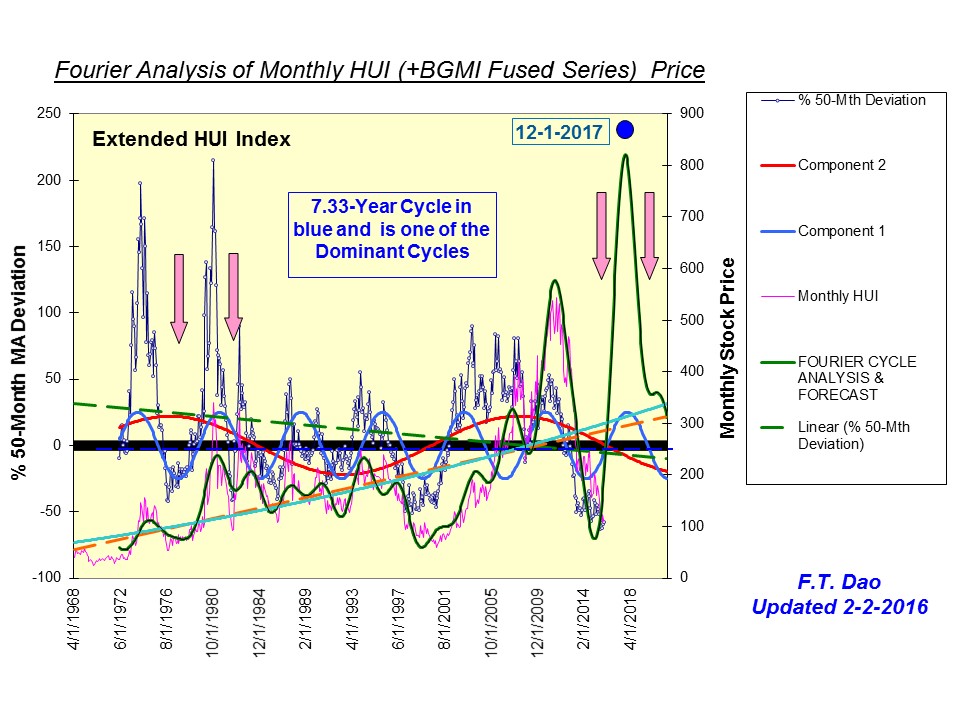
…The nature of the current gold bull market (2000 to 2020) is very similar to the 1980 bull market in cycle structure. Note the cycle profiles are generated internally from the long series of price data based on Fourier transformation. Below is a chart showing the gold stock index (HUI) with similar cycle patterns…
To estimate the next peak and value for gold and silver in this article, we used simple fractal price comparison. The peak value determined from Fourier based analysis is often underestimated as compared to this simpler method.
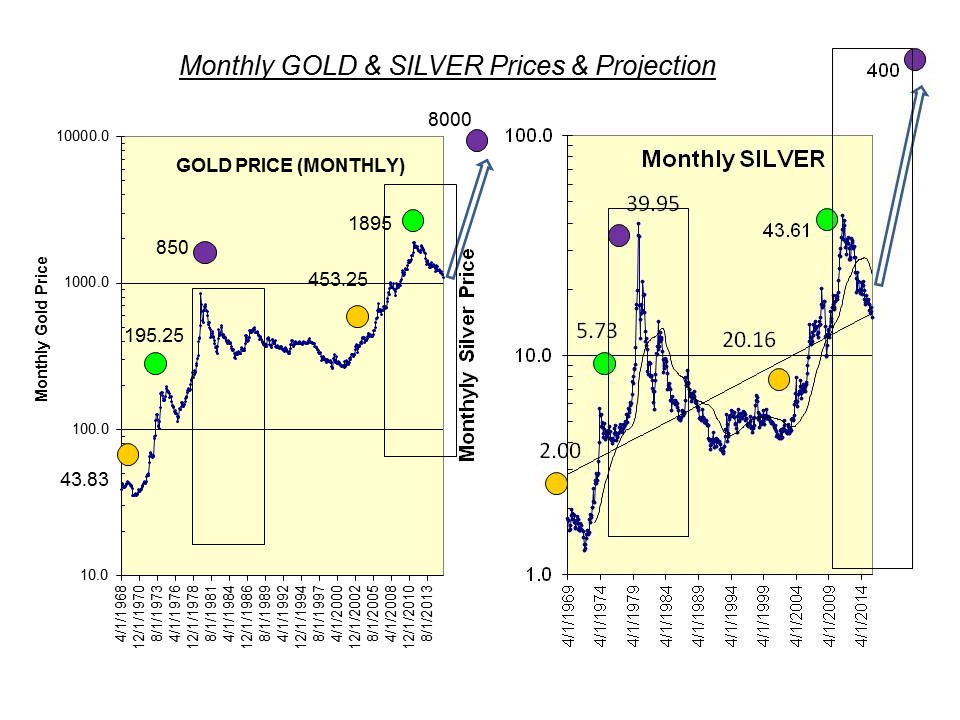
Gold And Silver Peak Values In 2020
The following chart shows the target gold and silver values in 2020 [of $8000/ozt. and $400/ozt. respectively]. We used a factor of 10 to project the third peaks in 2020…
Relative Performance of Gold. DOW Index, Silver And Gold Stocks
With the above estimated gold and silver prices in 2020, we compared the investment returns of gold and silver with that of the DOW for the 20-year period 2000 to 2020. We started all 4 asset classes with an initial investment of $100 and estimated the returns for the following periods:
- from 2000 to 2015,
- from 2000 to 2016 and
- from 2000 to 2020.
We computed the total gains and losses, and the compound growth rate per year [for each asset class]. The results, illustrated in the following chart and table, are interesting and unexpected.
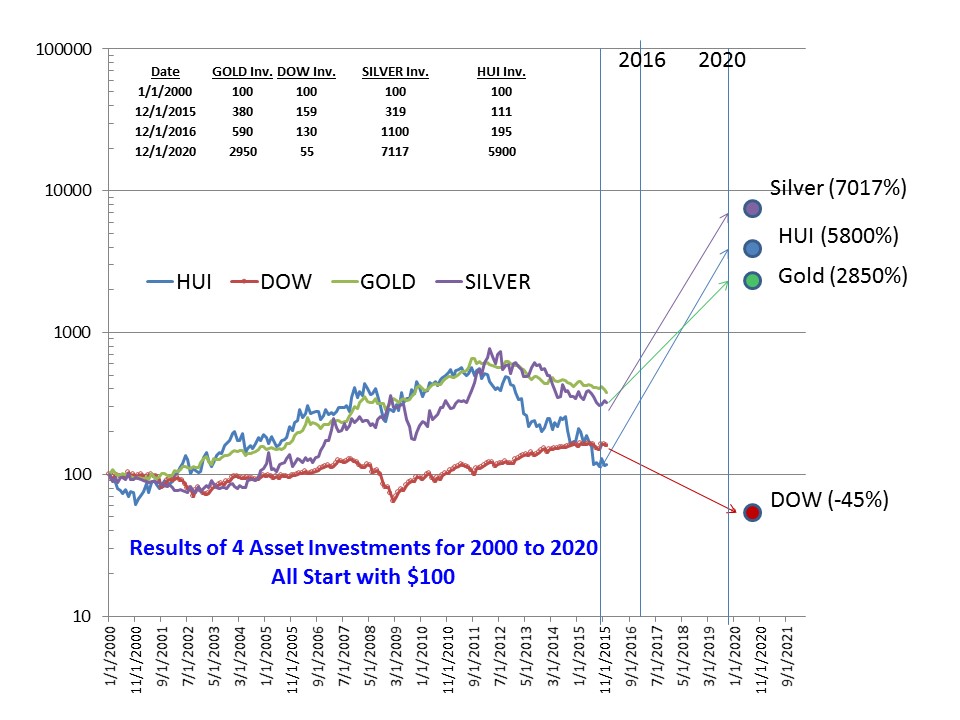
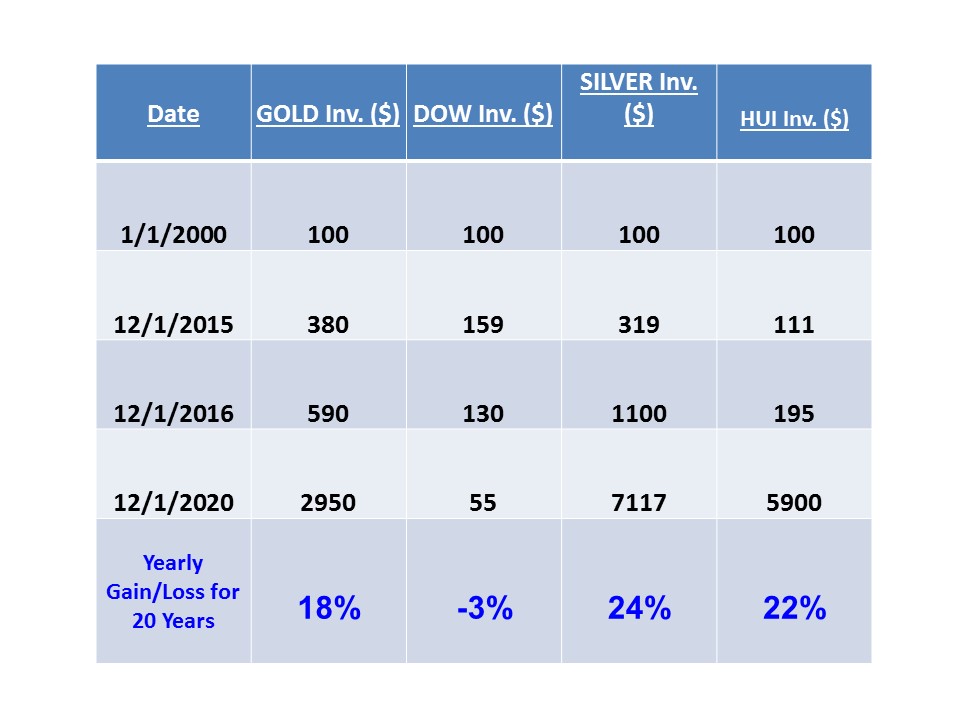
[As can be seen in the table above,]
- the DOW Index is projected to have an overall negative compound growth rate of -3% per year for the 20-year period from 2000 to 2020.
- The three other assets, namely gold, silver and gold stocks, [are] all [projected to] have positive growth rates…[between 18% and 24%] per year.
- Given the past 4 years of price correction for gold and silver, we expect a big jump in price gain by 2020, including the investment returns for the remainder of 2016…
- From now on, we believe the mining stock will be the best performer until 2020.
Implication for Asset Allocation
The identification of proper asset allocation to gain the maximum investment returns is clear from our analysis. Suffice to say, gold and silver ought to be the dominant asset class for astute investors right now. This asset is often neglected by fund managers. There are a few exceptions. For example the well known fund manager Stan Druckenmiller has invested 30% of his fund in gold funds, as opposed to 1-5% by other fund managers. As time goes on, there will be a rush into this asset class…