It’s been an amazing run in the stock market but…I start to feel a bit uneasy about things when I see all news reported as good news, because it either means the economy is getting better or more QE is coming. The fact, though, is that the market is just driving higher on what looks like sheer optimism of continued QE and little else. You can see this optimism in two indicators you’ll recognize.
So writes Cullen Roche (pragcap.com) in edited excerpts from his original article* entitled 2 Charts That Make Me Feel Uneasy About The Stock Market.
[The following article is presented by Lorimer Wilson, editor of www.munKNEE.com and the FREE Market Intelligence Report newsletter (sample here) and may have been edited ([ ]), abridged (…) and/or reformatted (some sub-titles and bold/italics emphases) for the sake of clarity and brevity to ensure a fast and easy read. This paragraph must be included in any article re-posting to avoid copyright infringement.]
Cullen goes on to say in further edited excerpts:
1. Total Market Cap to GNP
…The latest reading of 110% has only been surpassed by the Nasdaq bubble.
(click to enlarge)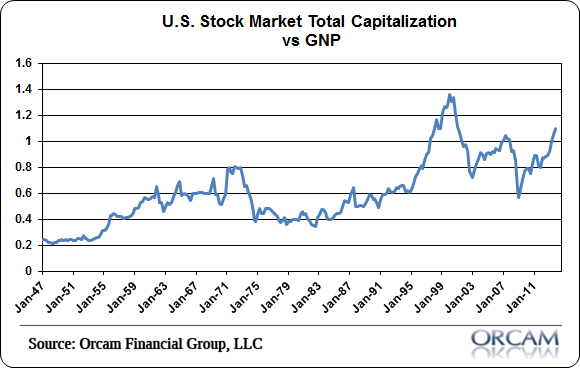
(chart via Orcam Research)
2. Margin Debt
The other chart that makes me feel uneasy is the amount of borrowing that’s being done to purchase equities as evidenced by NYSE margin debt at all-time highs:
(click to enlarge)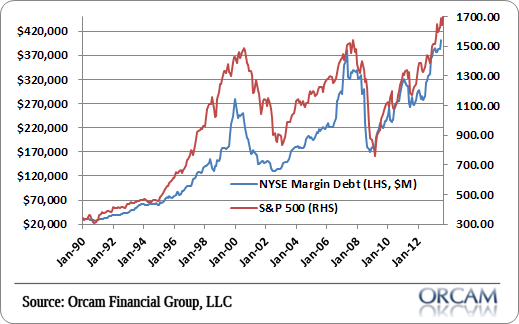
(chart via Orcam Research)
Conclusion
I’ll be honest – I’ve never really understood the obsession with equities, and being a macro guy I probably never will, because I have so much love for so many asset classes and approaches.
If I were 100% allocated in equities at this point in the cycle, however, I would feel rather uneasy about my positioning.
[Editor’s Note: The author’s views and conclusions in the above article are unaltered and no personal comments have been included to maintain the integrity of the original post. Furthermore, the views, conclusions and any recommendations offered in this article are not to be construed as an endorsement of such by the editor.]
*http://pragcap.com/2-charts-that-make-me-feel-uneasy-about-the-stock-market (Copyright © 2013 All Rights Reserved)
Related Articles for a Balanced View:
A. Pessimistic Views of the Market (see Optimistic Views at bottom of page)
1. 4 Clues That a Stock Market Collapse Is Coming
You might be well advised to keep your powder dry and your portfolio small – or even be tempted to sell everything and wait for the storm to blow over [given the 4 clues put forth in this article]. Read More »
2. Stock Market & Economy Could Be in BIG Trouble By End of October – Here’s Why
I generally shy away from making time-specific economic and stock market predictions simply because odds are very low you’ll be correct on both the prediction and the timing. However, there are certain times when the environment is conducive for a prediction that comes along with an expiration date. Today is one of those times. Read More »
3. Bernanke Has Created the Mother of ALL Stock Market Bubbles – Here’s Why

We have NEVER been this overextended above this line at any point in the last 20 years. Indeed, if you compare where the S&P 500 is relative to this line, we’re even MORE overbought that we were going into the 2007 peak at the top of the housing bubble. Read More »
4. A Stock Market Crash Followed This Occurrence In 1929, 2000 & 2007 – It’s Happening Again!
What do 1929, 2000 and 2007 all have in common? Those were all years in which we saw a dramatic spike in margin debt. In all three instances, investors became highly leveraged in order to “take advantage” of a soaring stock market but, of course, we all know what happened each time. The spike in margin debt was rapidly followed by a horrifying stock market crash. Well guess what? It is happening again. Read More »
Over the past 6 years, when the yield on high yield bonds (junk bonds) broke above resistance of bullish falling wedges, the S&P 500 ended up declining between 17% & 50%. Will it be different this time? Read More »
6. S&P 500′s PEG Ratio Suggests Overvaluation & Coming Correction

The S&P 500 index is trading at record high levels and optimism remains high with Barron’s professional money manager survey indicating a record 74% money managers being bullish on markets even at current levels. [When one] measures valuations with respect to expected growth, [however, the ensuing ratio, the PEG ratio,] suggests overvaluation at these levels. [Let me explain further.] Words: 254; Charts: 1 Read More »
7. These 5 Leading Investment Indicators Suggest the Stock Market Is OVERvalued – Take a Look
We have been in the throes of a secular bear market, subject to strong cyclical swings in either direction, since 2000. Currently, based on the 5 leading investment indicators analyzed in this article, the measures all confirm that, from a longer-term perspective, the market remains overvalued. Let’s take a look at each to see why that is the case. Read More »
8. Here’s How to Crash-Proof Your Portfolio

With the stock market seemingly reaching new highs every day, should we worry about a crash that puts an end to the party? If so, how should investors prepare? Let us explain. Read More »
9. This Metric Strongly Suggests a Major Correction in the S&P 500 Could Be Coming
History shows that when investors experience a rapid decline in the amount of available cash in their brokerage account to spend/invest quickly such “negative net worth” leads to major corrections in the stock market. Currently such is the case so can we expect another such decline or will it be different this time?
10. Level of Investor Margin Suggest Its Time to Lower Stock Exposure
In the 7 years that the Greedometer has been used there have been zero missed calls, and zero false alarms. The 7th warning began in January and in late February, the Greedometer gauge reached an epic 7900rpm which is marginally higher than the 7700rpm maximum reading seen 3 months prior to the S&P500 peak in October 2007. [This article outlines the development and successes of the Greedometer and the new Mini Greedometer and what they are predicting for the stock market in 2013.] Words: 1420
12. It’s Time to Apply the “Greater Fool Theory” and Sell Your Winners to All Those Fools
The Dow has surpassed its all-time record high – set in October 2007 – and the S&P 500 is not far behind? Is this the early stage of another great bull market? Let’s look back at the two previous times when the S&P 500 set new all-time highs and see if we can learn something. Wait…first put your “this time it’s different” glasses on. OK, let’s go. Words: 430; Charts: 1
13. Watch Out For Falling Stocks! Here’s Why
The stock markets make no sense. They have literally lost touch with reality. Divergences between fundamentals, confidence and the valuation of markets are large [and, as such,] cannot last for long….The only question is how…and how quickly….this correction occurs. Words: 261
14. Stop! Don’t Forget Market Risk – Remember What Happened in 2000 & 2007/8.
Investors are more bullish now than at any time since 2002 but the current rally has not been fueled by improved prospects of actual growth and wealth creation. Instead, it’s mostly due to:
- investors desperate for income denied them elsewhere by central bank policies;
- printed stimulus cash seeking a home and
- sheer technical momentum
but nowhere do they seem to be considering market risk – the risk that your investment will lose value because it gets dragged down in a falling market. Words: 615
15. Insider Trading Suggests That a Market Crash Is Coming
What you are about to read below is startling. Every time that the market has fallen in recent years, insiders have been able to get out ahead of time… [What] is so alarming [this time round is] that corporate insiders are selling 9 times as many shares as they are buying right now. So what does all of this mean? Could it be that they have insider knowledge that a market crash is coming? Evaluate the evidence below and decide for yourself. Words: 570
At some point we are going to see another wave of panic hit the financial markets like we saw back in 2008. The false stock market bubble will burst, major banks will fail and the financial system will implode. It could unfold something like this: Words: 660
B. Optimistic Views of the Market
1. Stock Market Bubble & Coming Recession? These Charts Say Otherwise
The real value of the stock market is positively correlated, over time, with the amount of freight hauled by the nation’s trucks (in other words, the physical size of the economy has a lot to do with the real, inflation-adjusted value of the economy) and the latest numbers (see chart) strongly suggest that we are not in a stock market bubble. Read More »
2. The Stock Market: There’s NOTHING to Be Bearish About – Take a Look
There’s nothing to be bearish about regarding the stock market these days. I’ve reviewed my 9 point “Bear Market Checklist” of indicators and it is a perfect 0-for-9. Not even one indicator on the list is even close to flashing a warning sign so pop a pill and relax. There’s no immediate danger threatening stocks. Read More »
3. Pop a Pill & Relax ! There’s NO Immediate Danger Threatening Stocks
Right now there’s nothing to be bearish about. I say that with conviction, because my “Bear Market Checklist” is a perfect 0-for-9. Heck, not a single indicator on the list is even close to flashing a warning sign. We’ve got nothing but big whiffers! Take a look. Pop a pill and relax. There’s no immediate danger threatening stocks. Read More »
4. Latest Action Suggests Stock Market Beginning a New Long-term Bull Market – Here’s Why
There are several fundamental reasons to believe that this week’s stock market activity, where the S&P 500 has moved more than 4% above the 13-year trading range defined by the 2000 and 2007 highs, could mark the beginning of a long-term bull market and the end of the range-bound trading that has lasted for 13 years. Read More »
5. Sorry Bears – The Facts Show That the U.S. Recovery Is Legit – Here’s Why

Today, I’m dishing on the unbelievable rebound in residential real estate, pesky rumors about the dollar’s demise and a resurgent U.S. stock market. So let’s get to it. Read More »
6. Correlation of Margin Debt to GDP Suggests Stock Market Has More Room to Run
Are stocks in a bubble? While leverage has returned to the stock market driving up stock prices and aggregate demand in the process, margin debt is still shy of its all-time high as a percentage of GDP, so there is certainly some headroom for further rises. A look at the following 5 charts illustrate that contention quite clearly. Read More »
7. Stocks Should Have a Record-Breaking Year According to These 7 Bullish Fundamentals
“A sluggish economy, political gridlock, tepid earnings, the European debt crisis, high gasoline prices…” I can’t really argue with Barron’s depiction of the current market environment yet, against all these seemingly negative conditions, the stock market keeps surging higher. Can it possibly continue, though? Read More »
8. Stocks Are NOT In Another Bubble – Here’s Why
U.S. stocks are off to one of their best starts in years. Most indices are up 10% year to date, prompting many investors to ask: “Are we in another bubble?” The answer is no, at least when it comes to equities. Here are three reasons why:
9. Research Says Stock Market Bull Should Continue Its Run Until…
The mainstream financial press would like us to believe that because the S&P 500 and Dow 30 are at or near their record highs that it must mean we’re nearing the end of the current bull market and, as such, now must be a terrible time to buy stocks. Let’s not jump to any conclusions, though. Instead, let’s do our own due diligence to find out. Hint: If you’ve been stuffing cash under the mattress since the last market crash, you might want to finally go deposit it in your brokerage account. Here’s why… Words: 420
10. These 4 Indicators Say “No Stock Market Correction Coming – Yet”
While I remain cautious on stocks and the risk trade, the technical picture shows that the uptrend to be intact and the bulls should still be given the benefit of the doubt for now. At this point, any call for a correction is at best conjecture [as evidenced by the following 4 indicators]. Words: 399; Charts: 4
The Swimsuit Issue Indicator says that U.S. equity markets perform better in years when an American appears on the cover of Sports Illustrated’s annual issue as opposed to years when a non-American appears on the cover. [What is the nationality of this year’s cover model? Can we expect returns above the norm or will we see a year of underperformance for the S&P 500 this year? Read on.] Words: 323 ; Table: 1
12. Bull Market in Stocks Isn’t About to End Anytime Soon! Here’s Why
As we all know, money printing always leads to inflation. It’s just a matter of figuring out which assets get inflated. This time around gold is not the only beneficiary, stocks are, too, and I’m convinced that the chart below holds the key to the end of the bull market. Words: 475; Charts: 1
13. QE Could Drive S&P 500 UP 25% in 2013 & UP Another 28% in 2014 – Here’s Why
Ever since the Dow broke the 14,000 mark and the S&P broke the 1,500 mark, even in the face of a shrinking GDP print, a lot of investors and commentators have been anxious. Some are proclaiming a rocket ride to the moon as bond money now rotates into stocks….[while] others are ringing the warning bell that this may be the beginning of the end, and a correction is likely coming. I find it a bit surprising, however, that no one is talking of the single largest driver for stocks in the past 4 years – massive monetary base expansion by the Fed. (This article does just that and concludes that the S&P 500 could well see a year end number of 1872 (+25%) and, realistically, another 28% increase in 2014 to 2387 which would represent a 60% increase from today’s level.) Words: 600; Charts: 3
14. 5 Reasons To Be Positive On Equities
For the month of January, U.S. stocks experienced the best month in more than two decades [and the Dow hit 14,009 on Feb. 1st for the first time since 2007]. Per the Stock Traders’ Almanac market indicator, the “January Barometer,” the performance of the S&P 500 Index in the first month of the year dictates where stock prices will head for the year. Let’s hope so…. [This article identifies f more solid reasons why equities should do well in 2013.] Words: 453
15. Start Investing In Equities – Your Future Self May Thank You. Here’s Why
As Winston Churchill once said: “A pessimist sees the difficulty in every opportunity; an optimist sees the opportunity in every difficulty” and in that vain I challenge all readers to fight off the negativity, see long-term opportunity in global equity markets and, most importantly, remain invested. Your future self may thank you. Words: 732; Charts: 6
16. Portfolio Up? Here’s a Powerful Strategy to Protect Your Gains
Use a portion of your portfolio in the form of credit spreads to protect and drive income over the next nine months. It’s an extremely simple strategy to learn and arguably the most powerful strategy in the professional options traders’ tool belt Read More »


