Gold: “YOU AIN’T SEEN NOTHING, YET”
We appear to be at a very interesting juncture in the precious metals sector at this time. As I noted in the last editorial, at this juncture in the 70’s fractal gold made a vertical move that would suggest a rise up into the $1,600s over the coming 4 or 5 weeks. Furthermore, I have a potential target for gold to rise up to $1,800 to $2,100 into May/ June of 2011 with a median target of around $1,950. Words: 610
So says The Goldrunner in an article* which Lorimer Wilson, editor of www.munKNEE.com, has reformatted and edited […] below for the sake of clarity and brevity to ensure a fast and easy read. (Please note that this paragraph must be included in any article re-posting to avoid copyright infringement.) The Goldrunner goes on to say:
Let’s look at the long-term gold chart.
GOLD
The top line in this chart comes in around $1,972 into mid 2011. I have other work that suggests a higher potential price up to around $2,250.

Gold and Silver Stocks – 2002 Déjà Vu?
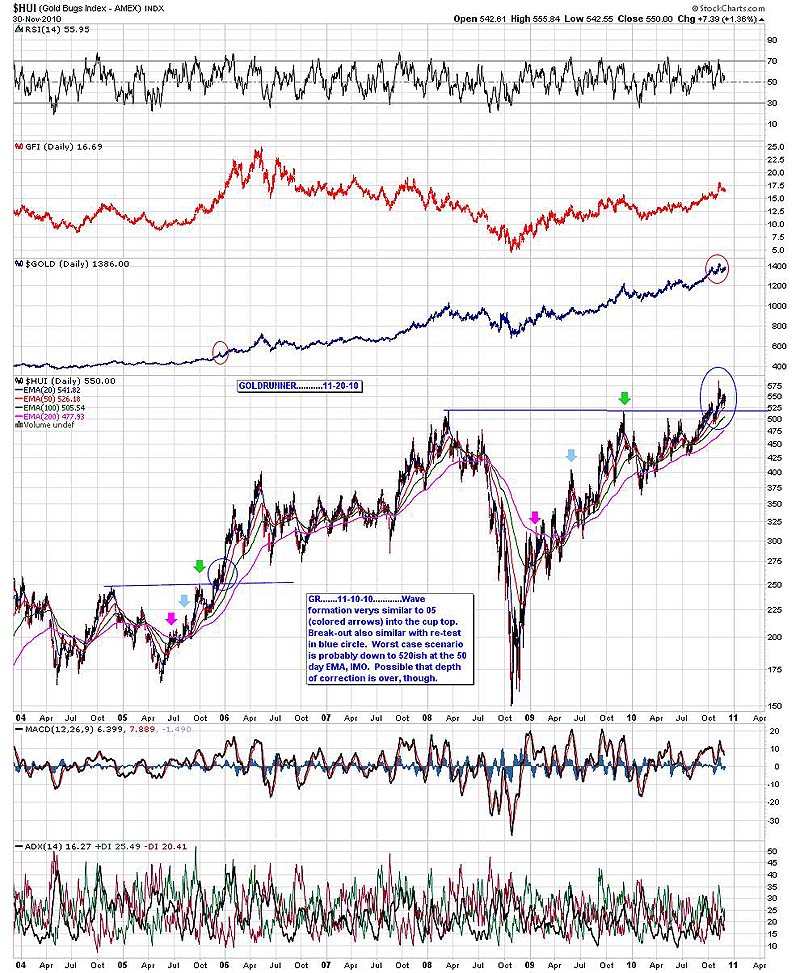
In the chart below we can see that the HUI (AMEX Gold BUGS (Basket of Unhedged Gold Stocks) Index) of 16 large/mid-cap stocks (see here) is continuing to exhibit its fractal relationship similar to that of late 2005 and the primary fractal in early 2002 when PMs showed a gap-up move to bust through a major angled line of resistance. The HUI has now broken out and appears to be completing a re-test of the top. Will it be “déjà vu- all over again” in the near future? I think we shall soon see. I have marked similar points in the HUI chart to show the similar characteristics to the 2005 period.
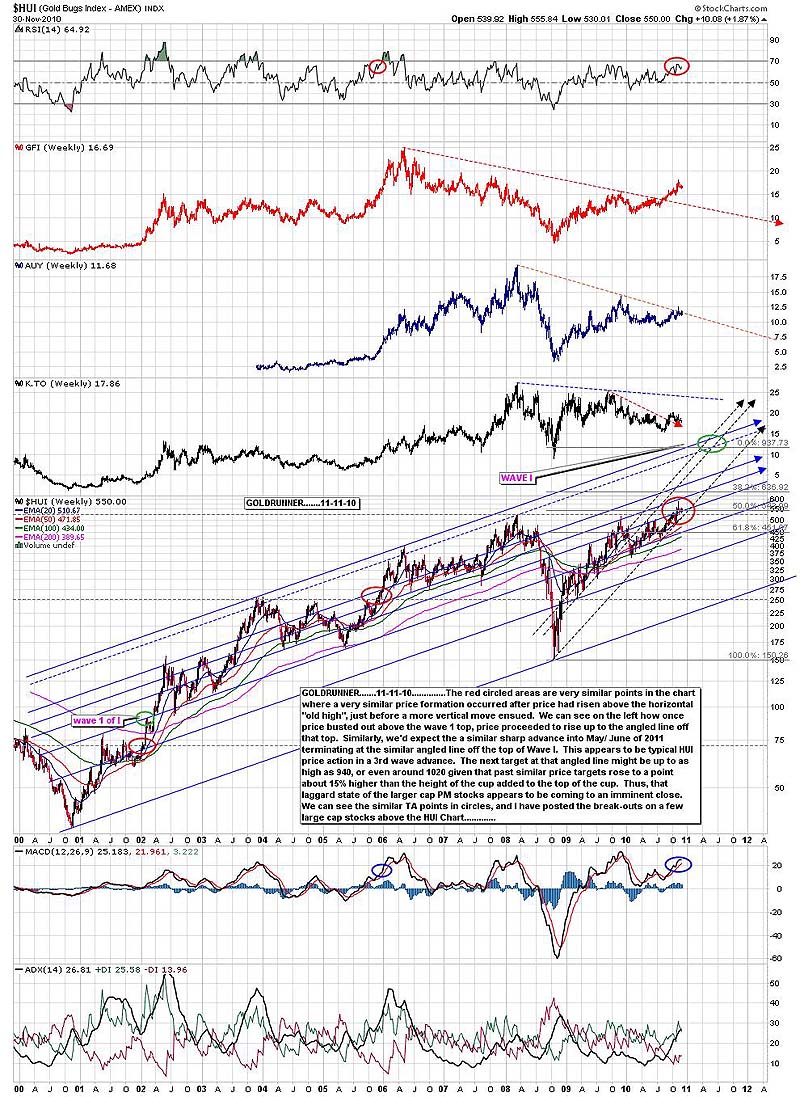
HUI target of 940-970 into May/ June 2011
The next chart of the HUI shows the similar price movements and indicators in the primary fractal of wave 3 of I (2002) versus the current 3 of Wave III movements. We can see that at this juncture in the Wave 1 fractal, price rose up to the angled line that extended off of the top of wave 1 of I. Thus, we expect the price rise into May/ June of 2011 to rise up to the angled line off of the top of Wave I. The similar rises in 2002 and 2005 were about 1.18 times (1.16 to 1.18) the height of the cup, added to the top of the cup. Thus, our potential target into May/ June of 2011 for the HUI lies up around 940 to 970. We’ll use the chart as a potential target zone and see how it plays out.
Explorers Stocks Starting to Run
The explorer gold and silver stocks are starting to run, too, and we expect them to perform much better into mid-2011. Many of their charts are exhibiting a “low chop” rise that is breaking out suggesting that the next target for many of these charts will be their “old highs.” Furthermore, as per the LT fractal back to the 70’s, these PM stocks still might have 90% of their gains ahead of them before this particular bull market is over. We have only reached the top of a mole hill on our trip up the mountain, it seems.
Conclusion
From my perspective, things are looking “real up” for gold and silver for most of the next two years.
Editor’s Note:
- The above article consists of reformatted edited excerpts from the original for the sake of brevity, clarity and to ensure a fast and easy read. The author’s views and conclusions are unaltered.
- Permission to reprint in whole or in part is gladly granted, provided full credit is given as per paragraph 2 above.
- Sign up to receive every article posted via Twitter, Facebook, RSS feed or our FREE “Top 100 Stock Market, Asset Ratio & Economic Indicators in Review”...
- Submit a comment. Share your views on the subject with all our readers.
Gold