 We have ongoing debt crisis talks in Europe, weak housing data in the U.S., tepid growth in Germany, and higher than expected inflation in the U.K. [and, in addition to] all this “cheerful” news, the recent “death cross” that [has occurred] on the S&P 500 Index.
While a “death cross” is concerning and should be respected it does not mean the end of civilization as we know it, however. [Below are the results of a long-term study that clearly defines what the short and mid-term implications are, in fact, for the market.] Words: 700
So says Chris Ciovacco (www.ciovaccocapital.com) in an article* which Lorimer Wilson, editor of www.munKNEE.com (It’s all about Money!), has further edited ([ ]), abridged (…) and reformatted below for the sake of clarity and brevity to ensure a fast and easy read. Please note that this paragraph must be included in any article re-posting to avoid copyright infringement. Ciovacco goes on to say:
A “death cross” is when the 50-day moving average crosses below the 200-day moving average and the slang term tells you it is not considered to be a bullish signal [as we wrote in an earlier article]:
The “death cross” formation historically has resulted in a 0.4% drop in the S&P the month after, but the market traditionally gains nearly 5% in the ensuing six months, according to a Wall Street Journal report Thursday. A 5% gain in six months is hardly “deadly”. We agree a “death cross” is not a good thing, and it does indicate a weakening market. However, all technical systems need to be viewed in the light of how the market performed after a signal occurred. A “death cross” is concerning and should be respected, but it does not mean the end of civilization as we know it.
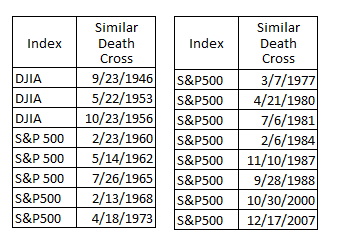
We studied market history going back to 1930 (the Dow Jones Industrial Average from 1930 to 1956; the S&P 500 from 1957 to 2011) looking for death crosses that occurred under similar conditions to what we have today [as identified below]:
- When the 50-day crossed the 200-day, the 200-day was flat or nearly flat.
- The death cross occurred after a substantial and prolonged rise in stock prices.
- Prior to the death cross, the slope of the 200-day moving average, for the most part, had been positive looking back several months to more than a year.
and found sixteen death crosses [as identified in the tables below]:
We calculated the risk-reward ratios for stocks following the death crosses above. The table below shows what we should care about: (a) percent of time stocks gained, (b) percent of time stocks lost money, (c) the average gain, (d) the average loss, (e) the risk-adjusted gain, (f) the risk-adjusted loss, and (g) the risk-reward ratio for being invested following similar death crosses in the past:
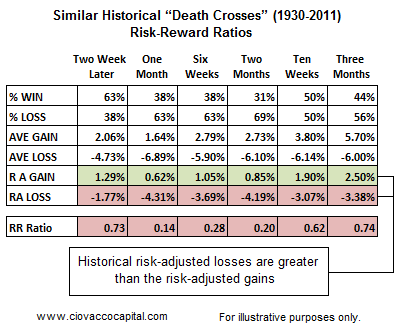
The term risk-reward implies that even in these historical cases, there were instances where stocks made money after the death cross, but the odds of success are lower than the odds of failure. Our analysis from July 13, “Gold and Silver Picking Up Steam Relative to Stocks,” aligns well with the recent death cross and less than favorable odds for stocks.
Who in the world is currently reading this article along with you? Click here to find out.
As can be seen in the charts below the S&P 500 experienced a Death Cross (see $SPX) earlier this week with stocks beginning to significantly underperformed gold as of July 13th (see SPY relative to GLD).


Conclusion
In recent weeks, we have been selling stocks and adding to our precious metals positions. Given the recent breakdowns in stocks, we like gold better than silver. We still like silver, but we will be watching it more closely than gold. We will err on the side of holding our gold. We remain concerned about stock market similarities to 2000 and 2008.
*http://seekingalpha.com/article/287924-stock-market-s-death-cross-looking-more-deadly-this-time?source=email_macro_view
Related Articles:
- The Investor Fear Gauge: What Everyone Should Know About the VIX
- Dow Theory Signals New Bear Market is Imminent
- This Pattern Forecast the Crash
- Any Way You Look At It the S&P 500 is Overvalued In Excess of 40%!
Editor’s Note:
- The above article consists of reformatted edited excerpts from the original for the sake of brevity, clarity and to ensure a fast and easy read. The author’s views and conclusions are unaltered.
- Permission to reprint in whole or in part is gladly granted, provided full credit is given as per paragraph 2 above.