The Dow:Gold ratio is defined as the ratio of the price of the Dow Jones Industrial Average divided by the price of gold [or] how many ounces of gold it takes to buy the 30-stock Dow. The current Dow:Gold ratio of 8.5 is up 21.1% from its 17-year March 6, 2009 low of 7.0 and 81% below its 1999 peak of 44.77. [What does the future hold? Higher gold prices, lower stock prices or vice versa?] Words: 400
So says Kirk Lindstrom in an article which Lorimer Wilson, editor of www.munKNEE.com, has further edited ([ ]), abridged (…) and reformatted below for the sake of clarity and brevity to ensure a fast and easy read. (Please note that this paragraph must be included in any article re-posting to avoid copyright infringement.)
Lindstrom goes on to say:
[Let’s take a look at the chart below for some insights.]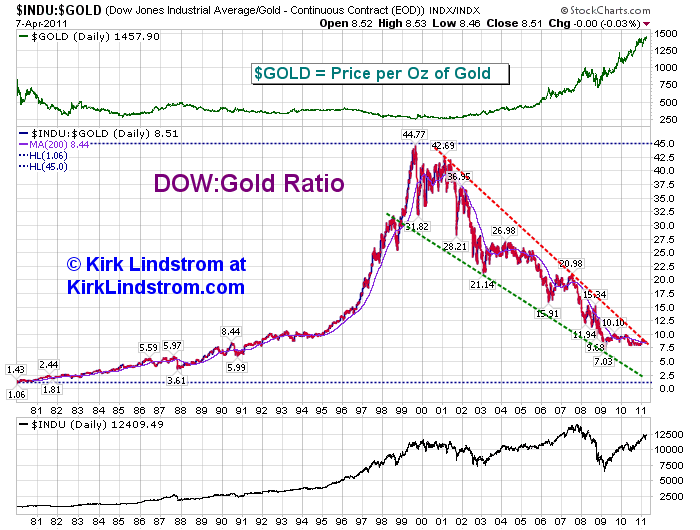
Click for larger image
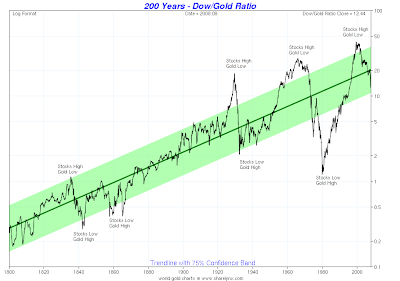
200 Year History of the Dow:Gold Ratio
The DJIA-to-gold ratio got down near 1 in the early 1980s and was just under 0.2 in the early 1800s as the 200 Year Dow:Gold chart below shows from 1800 through August 2008. At 8.5:1 today the ratio is trading below the green zone and the chart clearly shows that, historically, buying stocks when the ratio is below the green band was [always very] rewarding if you had patience.
(Click to enlarge)
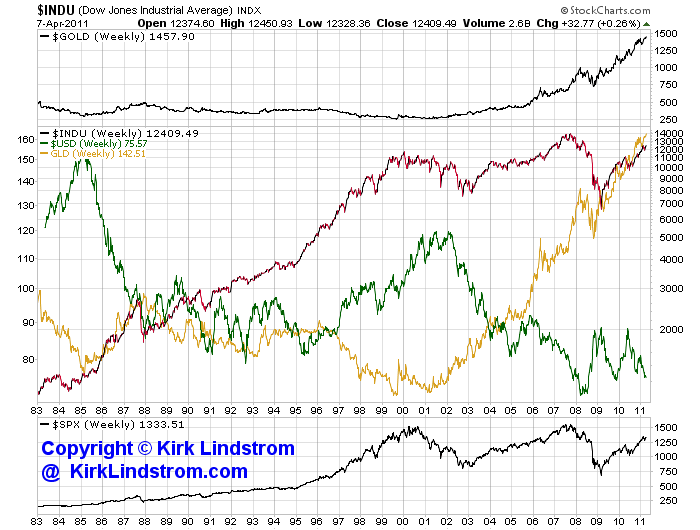
What’s Next for the Dow:Gold Ratio?
What is the best investment going forward? Below is a chart of the price of gold, its exchange traded fund GLD, the DJIA and the S&P500 [that begs the concluding questions]:
-
- Will stocks surge and the price of gold crash to break this decade long downtrend?
- Will gold surge and/or stocks fall to take this ratio lower for another run at its support level now below 2.5?
- Will both gold and stocks continue higher breaking the downtrend but not explosively?
*http://seekingalpha.com/article/262524-dow-gold-ratio-following-strong-resistance-lower-will-it-continue?source=email_the_macro_view