Investors are more bullish now than at any time since 2002 but the current rally has not been fueled by improved prospects of actual growth and wealth creation. Instead, it’s mostly due to 1) investors desperate for income denied them elsewhere by central bank policies; 2) printed stimulus cash seeking a home and 3) sheer technical momentum but nowhere do they seem to be considering market risk – the risk that your investment will lose value because it gets dragged down in a falling market. Words: 615
So writes Cliff Wachtel (http://thesensibleguidetoforex.com) in edited excerpts from his original article* entitled The One Thing You Must Remember Before You Buy Another Stock.
This article is presented compliments of www.munKNEE.com (Your Key to Making Money!) and may have been edited ([ ]), abridged (…) and/or reformatted (some sub-titles and bold/italics emphases) for the sake of clarity and brevity to ensure a fast and easy read. Please note that this paragraph must be included in any article re-posting to avoid copyright infringement.
Investors are more bullish now than at any time since 2002 so a brief reminder is in order:
- No matter how good the company’s prospects,
- no matter how high or solid the dividend,
- no matter what the analysts are telling you,
- and before you go long any risk asset, even if it’s a great income stock that will provide a steady high yield no matter what the market does,
consider market risk – the risk that your investment will lose value because it gets dragged down in a falling market.
Most risk assets move in the same direction, regardless of whether they’re stocks, commodities, or risk currencies. Most stocks move with the major relevant index, and most global stock indexes move in very close correlation.
How High is the Risk?
~First, look at the chart below of the S&P 500 for the past 14 years. Look at what happened to those who bought risk assets the last two times this bellwether index was at the current level (okay, another 50 points or so), back in 2000 and 2007. Markets plunged in the months that followed, ultimately ceding about half their value.
They came back but why risk the opportunity cost? Moreover, if they take years to recover, what will your stock be worth in real terms, given how the Fed and other leading central banks are trying to debase their currencies?
(click to enlarge)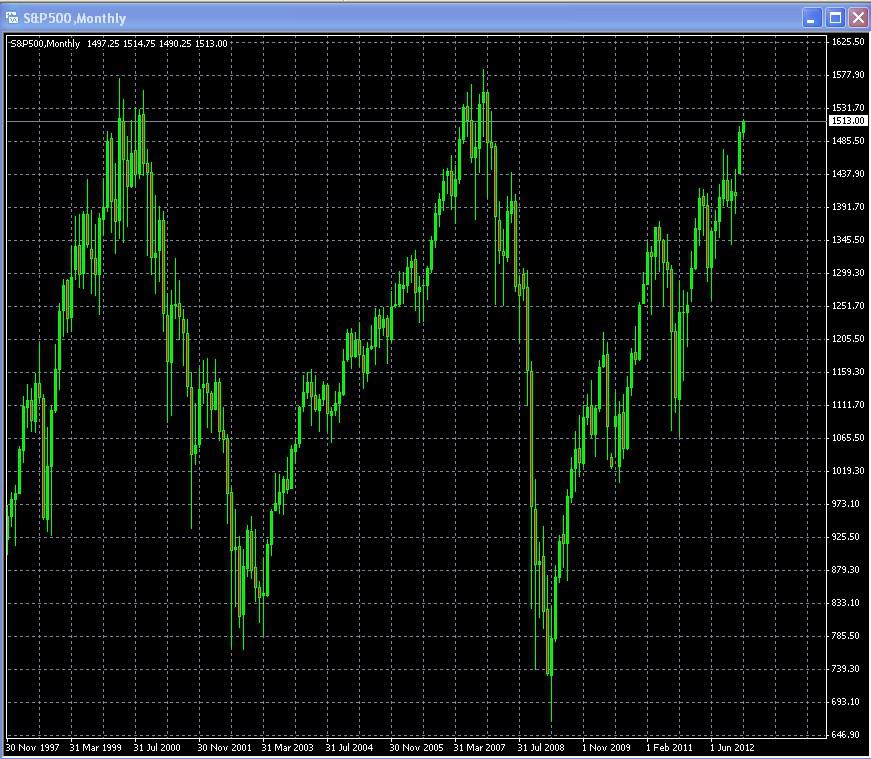
S&P 500 MONTHLY CHART1998 – PRESENT
Source: MetaQuotes Software Corp, thesensibleguidetoforex.com
Is This Time Different?
~Second, ask yourself this: is there reason to believe it will be different this time? Yes, but not for the better. The underlying fundamentals behind the current rally are worse than they were in 2000 and 2007. Just a few highlights include:
- At those prior peaks, growth, earnings, employment, jobs were all improving, or at least not stagnant or materially deteriorating.
- There was no global deleveraging to hamper spending for years to come…
- There was no unsolved EU debt crisis threatening to crash financial markets.
- The central banks behind the most widely held currencies were not openly committed to devaluing them and imposing another long-term drain on our purchasing power through currency debasement.
I could go on and on, but this is meant to be just a short reminder.
So Why Are Investors Bullish?
The current rally has not been fueled by improved prospects of actual growth and wealth creation. Instead, it’s mostly due to:
- Investors desperate for income denied them elsewhere by central bank policies
- Printed stimulus cash seeking a home. This is indeed a difference from the past. The only huge question is how long it can continue without a loss of purchasing power from debased currency that does more harm than the stimulus does good?
- Most recently, sheer technical momentum (of course, at decade highs momentum will be good).
All of the above could continue, but few believe they’re sustainable.
What Is the Risk Versus Reward?
Even medium risk investments are only paying about 6%, yet a normal correction could cost you 10-15% of your principle for a long time (at least in real terms), and also means opportunity cost (in principle and income) of missing a better, post-pullback purchase.
Again, nothing new here — it’s just a needed reminder. Remember what happened the last time.
Editor’s Note: The author’s views and conclusions are unaltered and no personal comments have been included to maintain the integrity of the original article. Furthermore, the views, conclusions and any recommendations offered in this article are not to be construed as an endorsement of such by the editor.
*http://thesensibleguidetoforex.com/2013/02/12/the-one-thing-you-must-remember-before-you-buy-another-stock/
Related Articles:
1. Insider Trading Suggests That a Market Crash Is Coming
What you are about to read below is startling. •Every time that the market has fallen in recent years, insiders have been able to get out ahead of time… •[What] is so alarming [this time round is] that corporate insiders are selling nine times as many shares as they are buying right now. •In addition, some extraordinarily large bets have just been made that will only pay off if the financial markets in the U.S. crash by the end of April. •So what does all of this mean? [Could it be that they] have insider knowledge that a market crash is coming? Evaluate the evidence below and decide for yourself. Words: 570
At some point we are going to see another wave of panic hit the financial markets like we saw back in 2008. The false stock market bubble will burst, major banks will fail and the financial system will implode. It could unfold something like this: Words: 660
3. Bull Market in Stocks Isn’t About to End Anytime Soon! Here’s Why
As we all know, money printing always leads to inflation. It’s just a matter of figuring out which assets get inflated. This time around gold is not the only beneficiary, stocks are, too, and I’m convinced that the chart below holds the key to the end of the bull market. Words: 475; Charts: 1
4. What Recovery? Contradictions Between Reality & Political Claims Are Everywhere!
There is no recovery, regardless of what the elite and their minions in the media want you to believe. The economy is sick. It was made so by the malpractice of government and will become even weaker as government continues to administer the poison that got us to this point. The political class’s version of remedy is akin to the medical profession’s practice of bloodletting. Neither does any good and both, carried to extreme, are fatal. [Let me explain more fully.] Words: 548
5. Ignore Wall Street Cheerleaders: Market Technicals, Fundamentals & Other Info Says Otherwise!
[In spite of what] the typical Wall Street cheerleaders, I mean strategists, are predicting, we see the equity market ever more closer to its cyclical top, miners about to retest a major bottom and hard assets with a new catalyst. [This article analyzes 9 pieces of information, complete with charts, that show what is actually going on in the marketplace at this point in time and what the short-term future holds.] Words: 930; Charts: 8The Swimsuit Issue Indicator says that U.S. equity markets perform better in years when an American appears on the cover of Sports Illustrated’s annual issue as opposed to years when a non-American appears on the cover. [What is the nationality of this year’s cover model? Can we expect returns above the norm or will we see a year of underperformance for the S&P 500 this year? Read on.] Words: 323 ; Table: 1
7. QE Could Drive S&P 500 UP 25% in 2013 & UP Another 28% in 2014 – Here’s Why
Ever since the Dow broke the 14,000 mark and the S&P broke the 1,500 mark, even in the face of a shrinking GDP print, a lot of investors and commentators have been anxious. Some are proclaiming a rocket ride to the moon as bond money now rotates into stocks….[while] others are ringing the warning bell that this may be the beginning of the end, and a correction is likely coming. I find it a bit surprising, however, that no one is talking of the single largest driver for stocks in the past 4 years – massive monetary base expansion by the Fed. (This article does just that and concludes that the S&P 500 could well see a year end number of 1872 (+25%) and, realistically, another 28% increase in 2014 to 2387 which would represent a 60% increase from today’s level.) Words: 600; Charts: 3
8. The S&P 500 Continues to Rapidly Build Its “Domed House” As Projected
The broad stock market is on its way to building a “Domed House” and to challenge multi-year highs, or even all-time highs, in the process. Words: 634; Charts: 2
9. Investors, Get Fully Invested! S&P 500 On Verge of Entering Euphoria Stage of Cyclical Bull Market
[In spite of all that is seemingly wrong with the U.S. economy] I think we are on the verge of entering the euphoria stage of this cyclical bull market where traders become convinced that QE3 is a magic elexir with no unintended consequesnces. [As such,] I see a strong acceleration and a significant and sustained breakout above the S&P 500 September high of 1475. (Words: 264 + 3 charts)10. These 4 Indicators Say “No Stock Market Correction Coming – Yet”
While I remain cautious on stocks and the risk trade, the technical picture shows that the uptrend to be intact and the bulls should still be given the benefit of the doubt for now. At this point, any call for a correction is at best conjecture [as evidenced by the following 4 indicators]. Words: 399; Charts: 4
11. 5 Sound Reasons Investors Would Be Better Off On the Sidelines Than In the Market
New year festivities have continued on the stock market even as the Christmas trees have been put away. The “death of the fiscal cliff,” not horrible job numbers and supportive comments from Mario Draghi on the other side of the pond have led to bold and bullish behaviors over the last three weeks. While no one can predict the exact peak, here are five reasons you’re better off on the sidelines than in the market.
12. These Charts Suggest a Possible +/-60% Decline in the S&P 500 by 2014
J.P. Morgan Asset Management has developed a chart showing the past two cycles in the S&P 500 highlighting peak and trough valuations. At face value it is very alarming as it suggests a potential decline of somewhere in the vicinity of 60% over the next year or two and concurs with previous innovative trend analyses included in this article. Charts: 4
13. 3 Reasons the Stock Market Could Rally & 3 Reasons to Be Cautious Near Term
The U.S. stock market rally that kicked off the New Year continued last week, and after only two weeks, US stocks are up around 3% for the year. European stocks have posted similar gains and equities in Japan have advanced even further. What’s behind this rally – and more importantly, can it continue? In my view, the rally can be attributed to three factors. Words: 615
14. Start Investing In Equities – Your Future Self May Thank You. Here’s Why
As Winston Churchill once said: “A pessimist sees the difficulty in every opportunity; an optimist sees the opportunity in every difficulty” and in that vain I challenge all readers to fight off the negativity, see long-term opportunity in global equity markets and, most importantly, remain invested. Your future self may thank you. Words: 732; Charts: 6
15. Don’t Ignore This Fact: “Greedometer Gauge” Signals S&P 500 Drop to the 500s by July-August, 2013!
The S&P500 is likely to achieve a secular (long term) peak this month, then drop to the 500s by July-August 2013. This article explains why. Words: 180
16. Current Market Overvaluation (from 33% – 51%!) Suggests Cautious Long-term Outlook
Based on the latest S&P 500 monthly data, [my analyses indicate that] the market is overvalued somewhere in the range of 33% to 51%, depending on which of 4 indicators I used. This is an increase over the previous month’s 31% to 48% range. [Let me explain the details.] Words: 475
17. Goldman Sachs’ Leading Indicators Signal Steep Market Crash Ahead
Goldman Sachs reports their Global Economic Indicators (GLI) show the world has re-entered a contraction and…is predicting a market crash worse than that of the early 90′s recession and one slightly less than the sell-off at the turn of the millennium. [Below are graphs to support their contentions.] Words: 250
18. Will a Black Swan Event Cause the S&P 500 to Drop by 40%?
Mark Spitznagel…warned the other day that the S&P 500 could lose 40% of its value in the next couple of years. So what black swan event could cause the S&P 500 to drop down to 760? [Let’s take a closer look.] Words: 856