 The gold-to-silver ratio indicates whether gold or silver is undervalued or overvalued relative to each other. Many people believe the ratio should be roughly 16:1, since it was the level observed [over the] centuries, but this is nonsensical reasoning. [Let me explain.]
The following are excerpts from the original article by Arkadiusz Sieroń (SunshineProfits.com) which has been slightly edited ([ ]) and abridged (…) to provide a fast and easy read.
The gold-to-silver-ratio is an indicator that shows how many silver ounces are required to purchase an ounce of gold. The gold-to-silver ratio is one of the most important parameters in the precious metals market, as it measures the relative value of gold and silver. Therefore, it is a useful tool indicating whether gold or silver is undervalued or overvalued relative to each other. Investors can use the ratio as a timing indicator deciding when to buy gold or silver, or which metal to buy at any given time. When the ratio is low, it means that silver is overvalued relative to gold (and vice versa).
How does the gold-to-silver ratio work? When we write these words, the price of gold is about $1210 and silver is traded at $16. Thus, the ratio amounts to 75.6. Is it high or low? Well, it depends on the view of the normal level. There are many people who believe that the ratio should be roughly 16:1, since it was the level observed for centuries. These analysts argue that this level is generally in line with the relative abundance of each metal within the earth’s crust.
However, this is nonsensical reasoning. Investors should remember that historical numbers from the era of bi-metallism are simply not reliable since the ratio was set by governments. Actually, the U.S. government controlled the price of one or both metals up to the 1970s.
And although it is true that the proportion of silver to gold in the earth’s crust is around 17.5 (so not very far from the 16), commodities prices are not based only on their relative supply. Any price is the result of the interplay of supply and demand. Precious metals investors should not forget about the demand side of the equation. Gold is much more valuable as a monetary asset.
Let’s examine the chart below which shows how many silver ounces it has cost to buy a single ounce of gold since 1975, and determine the prevalent range for the ratio. This analysis will help assess the claims that the gold-to-silver ratio should revert to its “true” level around 16, i.e. that the price of silver is deeply undervalued and has to skyrocket.
Chart 1: The gold-to-silver ratio (the price of gold divided by the price of silver, red line, right axis), the price of gold (yellow line, left axis, London A.M. Fix) and the price of silver (blue line, right axis, London Fix) from 1975 to 2015.
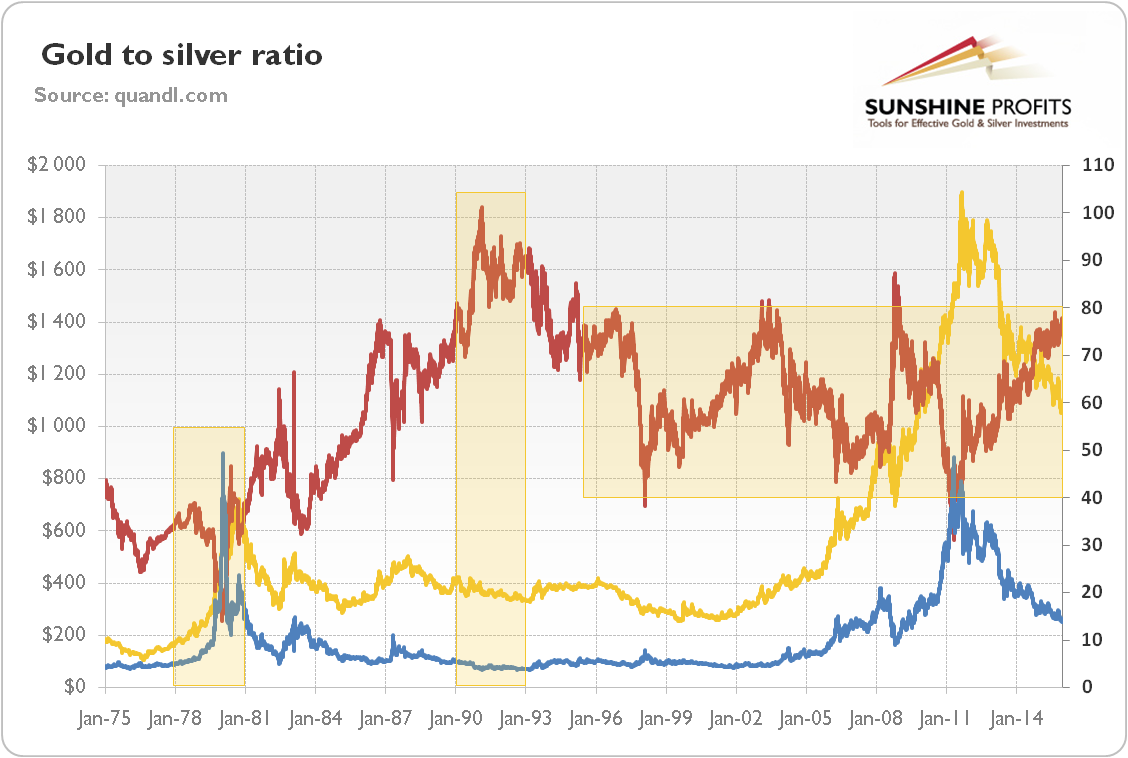
As one can see, the gold-to-silver ratio has been fluctuating wildly, ranging between 14 and 101. In the 1970s, the ratio was declining, bottoming in 1980. It means that back then silver was very expensive in relation to gold, as the Hunt brothers fueled a boom in the silver market. Silver spiked to $40 (and later to $50), when gold traded at $560, producing a ratio of 14. As the silver bubble burst, the ratio rose and continued until 1991, when it reached its all-time high. Silver was then very cheap relatively to gold, as there was a recession, which decreased the industrial demand for silver.
The price of silver plunged to $3.50 when gold traded at $360, sending the ratio above 100. Since the mid-1990s, the gold-to-silver ratio has been generally traded in a range between 40 and 80. The most important exceptions are 2008 and 2011. Just after the outbreak of the financial crisis in late 2008, gold prices dropped to around $730 in October. However, the price of silver plunged harder, to around $9.
Although gold prices fell initially after the crisis, gold behaved as the safe-haven asset when compared to silver. Consequently, the gold-to-silver ratio jumped above 80. In 2011, gold reached its all-time high of almost $1900. However, silver jumped from $30 to almost $50. As a result, the gold-to-silver ratio plunged below 40.
To sum up, the detailed analysis of the relationship between gold and silver clearly debunks silver bugs’ myths that the gold-to-silver ratio has to revert to its historical level around 16 and stay there for a considerable amount of time.
- In reality, since the mid-1990s, the ratio traded between 40 and 80, averaging between 50 and 60.
- In modern times, a ratio smaller than 20 occurred only once when the Hunt brothers created a bubble in the silver market when they tried to corner silver bullion.
Investors have to remember that the argument that gold-to-silver ratio has to revert to around 16 and the price of silver has to surge is based on historical ratios from the 18th and 19th centuries, when bi-metallism was the prevailing monetary standard and the exchange rate between gold and silver was fixed. The gold to silver ratio could spike to certain levels at local tops (indicating or confirming them as a technical sign) but that is a different matter.
Disclosure: The above article was edited ([ ]) and abridged (…) by the editorial team at  munKNEE.com (Your Key to Making Money!) to provide a fast and easy read.
“Follow the munKNEE” on Facebook, on Twitter or via our FREE bi-weekly Market Intelligence Report newsletter (see sample here , sign up in top right hand corner)
The simplest thing to do would be to look at how much silver is coming out of the ground PRESENTLY compared to gold.
That number 9:1.
This whole article is based on paper trading markets and not reality.
Reality will show in the future there is much less silver available to industry in coin/bar form and this will reflect in the price.
I fully expect the GSR to invert one day as silver’s dwindling supplies are understood by industrial users and they start hoarding.