While Yardeni’s forecast may seem outlandish given the economic and fundamental backdrop, the market cycle supports the claim.
An article by Lance Roberts, Chief Editor of the “Real Investment Advice” website. Comments in bold and in color have been added by munKNEE.com for emphasis.
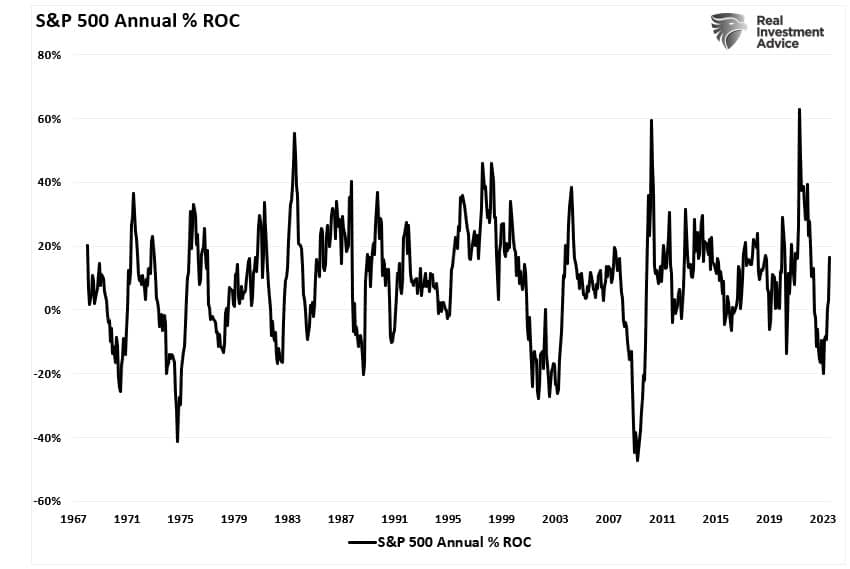
The chart below is the annual rate of change for the S&P 500 index. Unsurprisingly, as noted, the cycles are pretty obvious. However, the trough of the market cycle in October is evident. Such provides room for the current market cycle to continue higher.
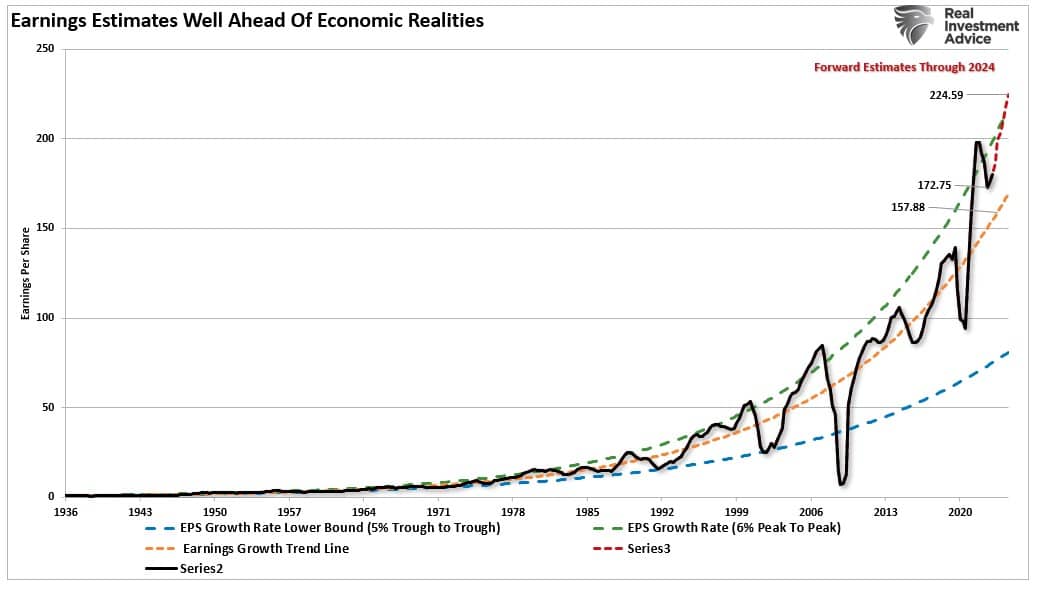
Unsurprisingly, earnings, which ultimately are reflected by the market’s price, are cyclical along with economic strength and weakness. We see the correlation when we overlay the annual rate of earnings change over the graph above. Such suggests that market participants are betting the earnings cycle troughed in Q1 2022 and will improve into 2024. This supports Yardeni’s claim of higher asset prices over the next 12-18 months.
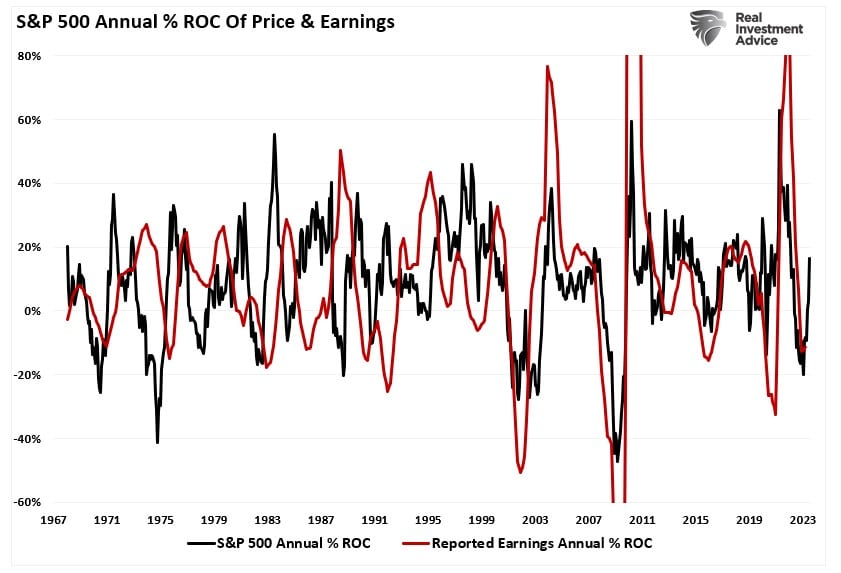
However, given earnings are derived from consumer activity, the economic cycle must begin to improve for earnings to increase.
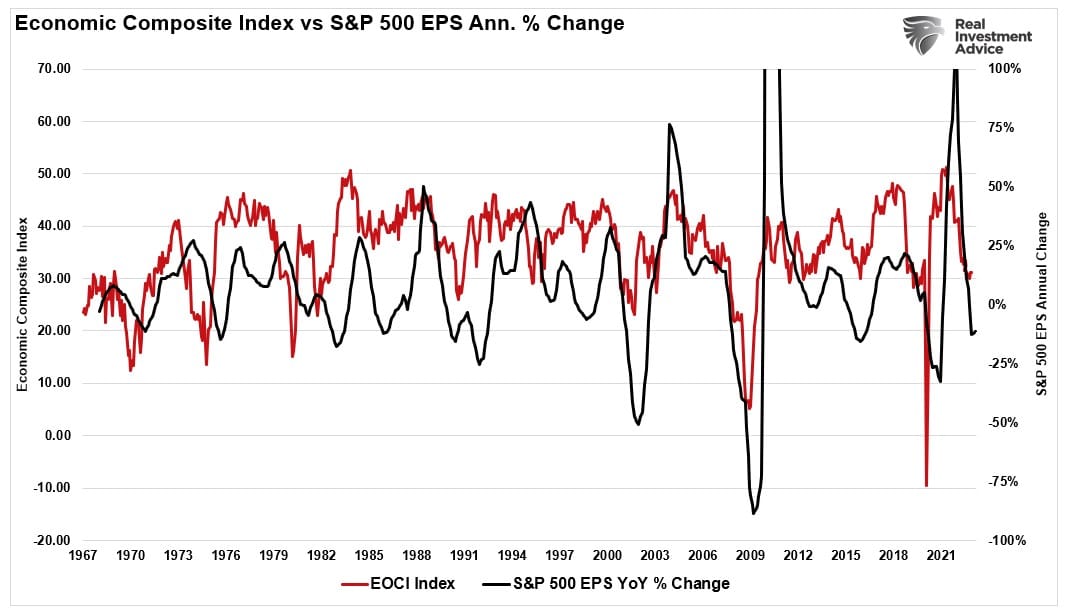
As with market cycles, the economy cycles as well. There is little argument current economic data is weak whether viewing the Leading Economic Index (LEI) or Institute Of Supply Management (ISM) measures. As with the market cycle, long periods of slowing economic activity will eventually bottom and turn higher. The Economic Composite Index, comprised of 100 hard and soft economic data points, clearly shows the economic cycles. I have overlaid the composite index with the 6-month rate of change of the LEI index, which has a very high correlation to economic expansions and contractions.
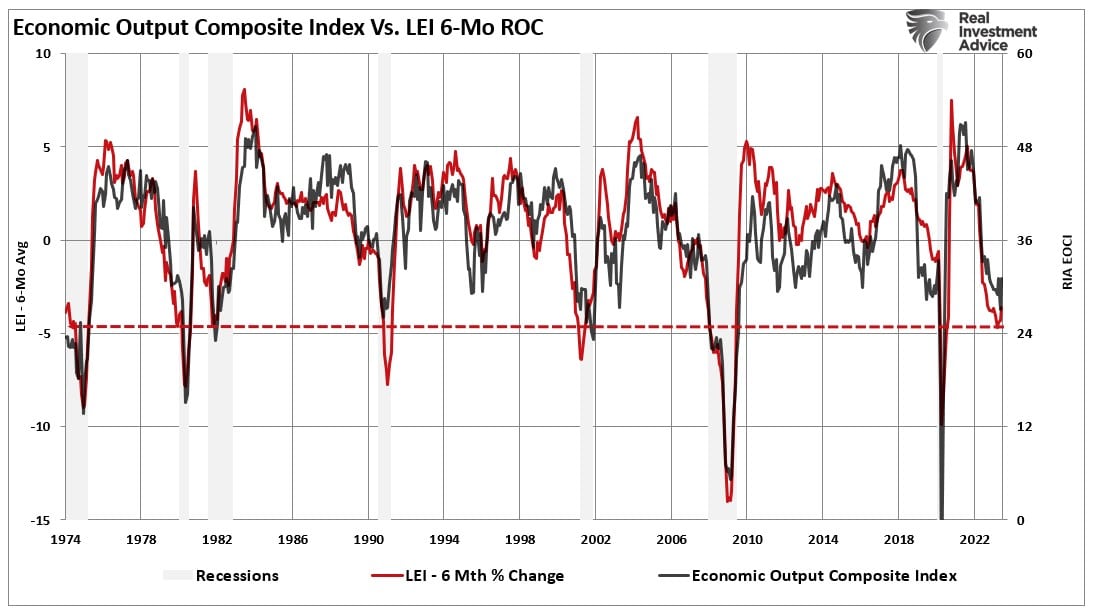
These economic measures are at levels that, outside financial crises or economic shutdown events, marked the bottoms of previous economic contractions. Such suggests that we may see some improvement in economic activity in the coming months. If that is the case, we should also expect the earnings cycle to improve.
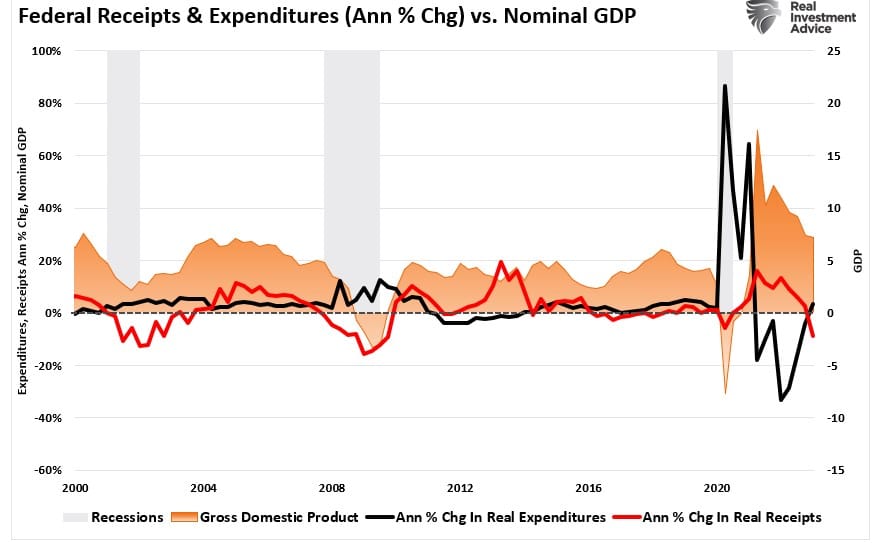
While there are reasons to remain suspect of an upturn in the current economic and market cycles, it isn’t easy to completely discount the historical evidence. Yes, the Federal Reserve has hiked rates aggressively, which weighs on economic activity by reducing personal consumption. However, as we noted recently in our article on tax receipts as a leading recessionary indicator, the government continues to increase spending levels supporting economic growth.
While I suggest we could see continued improvement in both the economic and market cycles, I am somewhat skeptical of Ed Yardeni’s more optimistic view. There are certainly headwinds to the economic and earnings recovery over the next 12-18 months. As noted, the impact of higher interest rates, tighter bank lending standards, and falling inflation will undermine Ed’s view. Such will result in disappointment as those more optimistic outlooks will have to realign with economic realities.
However, while the current economic and market cycles suggest a turn higher in the coming months, such does not preclude a correction.
“Despite his positive outlook, Yardeni expresses concerns about a potential market correction in the near term. He worries that the significant rally seen this year may lead to an overheated market, which could result in a subsequent downturn. Yardeni emphasizes the importance of a stable and controlled bull market, as excessive gains often precede sharp declines.”
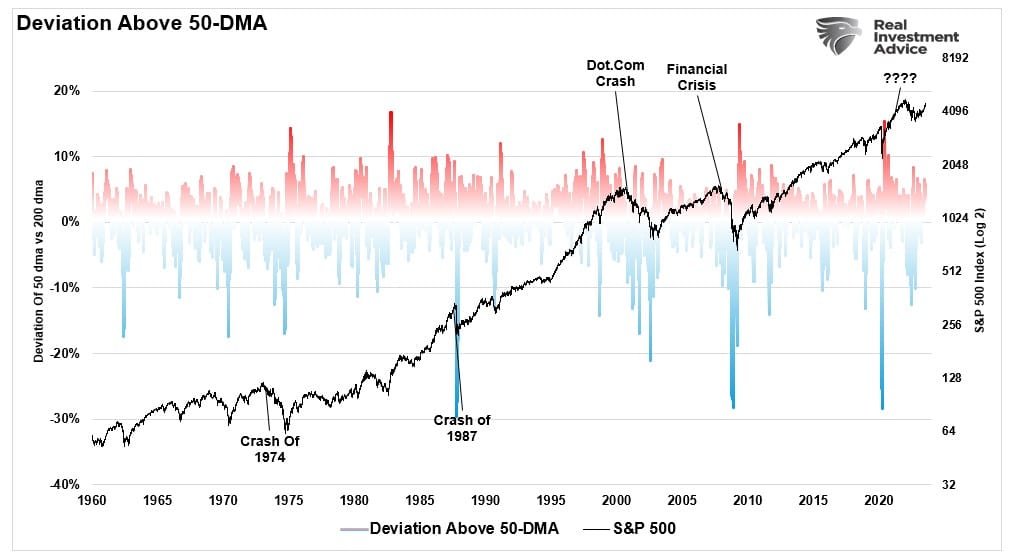
That is an essential and valid statement. In a bullish market cycle, as we are now, investors begin to believe the market can only go higher. However, we have repeatedly warned recently that a 3-5% correction in any given year is normal, even in bullish markets. As shown, when the market excessively deviates above the 50-day moving average, it tends to revert below that moving average regularly. That correction may have started last week.
These corrections are just the reversion of short-term excesses due to speculative market activity. As portfolio managers, this is why, during very short-term periods, we give more weight to technical versus fundamental analysis. One such analysis is our technical overbought/sold gauge which comprises several price indicators (RSI, Williams %R, etc.) and is measured using “weekly” closing price data. Readings above “80” are considered overbought, and below “20” is oversold. Given this is weekly data, its readings move slowly and align with short-term peaks and troughs of markets. Not surprisingly, a market correction occurred after pushing above the “90” level.
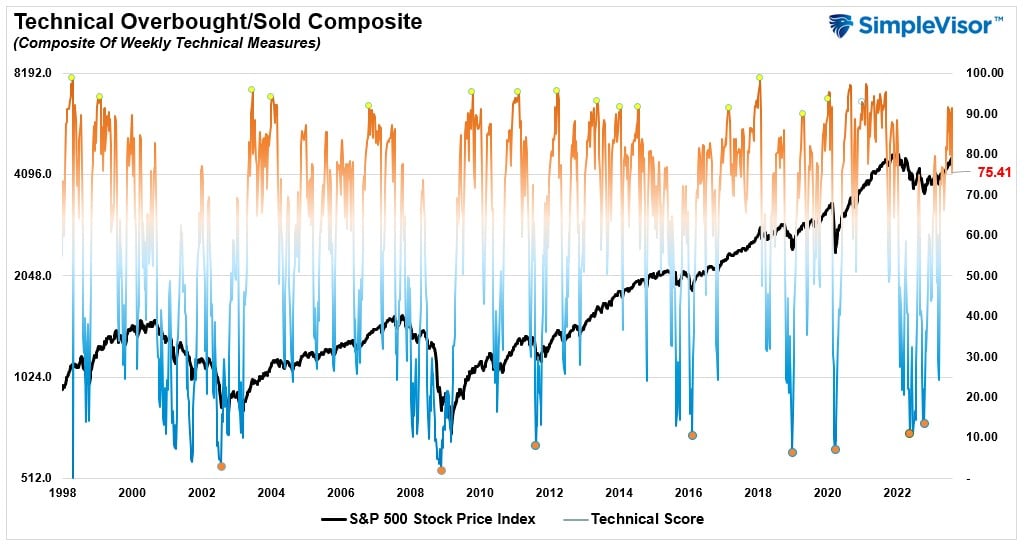
The current overbought condition of the market historically aligns with short-term market corrections. However, market risks become more evident when combining the technical with sentiment readings.
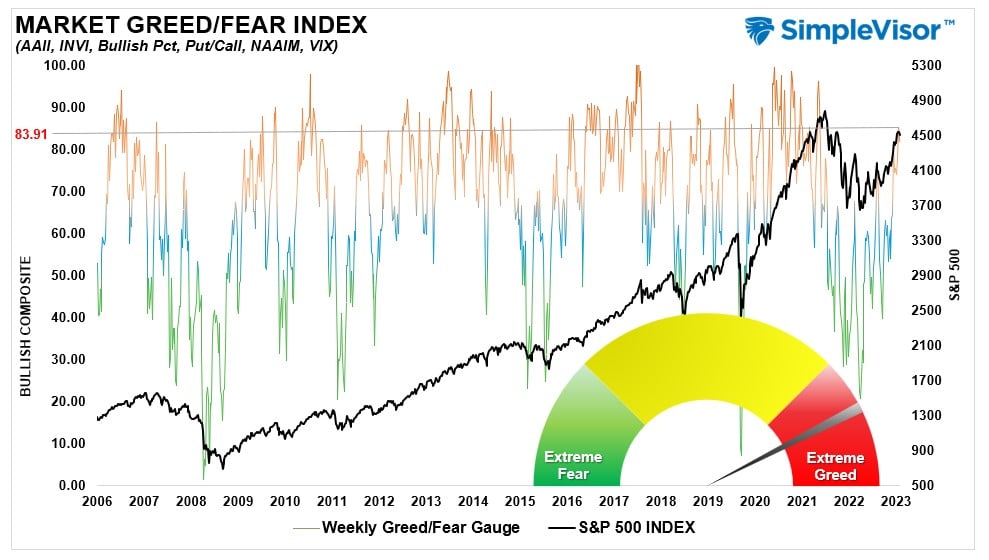
The “Fear/Greed” gauge is how individual and professional investors are “positioning” themselves in the market based on their equity exposure. From a contrarian position, the higher the allocation to equities, the more likely the market is closer to a correction. The gauge also uses weekly closing data.
Conclusion
With both technical and sentiment readings suggesting the short-term market risks are elevated, it is likely wise that investors use the current speculative frenzy to rebalance portfolio risks accordingly.
- Tighten up stop-loss levels to current support levels for each position.
- Hedge portfolios against major market declines.
- Take profits in positions that have been big winners.
- Sell laggards and losers.
- Raise cash and rebalance portfolios to target weightings.
While the current economic and market cycles will likely turn more bullish, the market has already “priced in” that improvement. Such leaves investors at risk of potential disappointment. Taking action to rebalance portfolio risks allows for taking advantage of corrections during improving market cycles. If I’m wrong, and the subsequent correction is a resumption of the bear market, then reduced allocations ahead of time will hedge portfolios against that risk as well.