[We have determined that] the current cyclically adjusted real yield of 5.28% is telling us that the stock market is expensive, at least by historical standards. [In addition,] …we have also determined that, relative to bonds, the real spread between stocks and bonds is 7.2% in terms of yields, i.e., stocks relative to bonds seem cheap. If stocks are expensive, and stocks relative to bonds seem cheap, this implies that bonds are also expensive. Everything is expensive! [Let me show you the math that confirms just that.] Words: 1590
So says the Turnkey Analyst (www.TurnkeyAnalyst.com) in an article* on SeekingAlpha.com which Lorimer Wilson, editor of www.munKNEE.com (Your Key to Making Money!), has further edited ([ ]), abridged (…) and reformatted below for the sake of clarity and brevity to ensure a fast and easy read. The author’s views and conclusions are unaltered and no personal comments have been included to maintain the integrity of the original article. Please note that this paragraph must be included in any article re-posting to avoid copyright infringement.
The article goes on to say:
Determing the Real Return of Equities
One of Robert J. Shiller’s…tools for thinking about equity values is the market’s cyclically adjusted P/E [CAPE] ratio…[Below is a] calculation of Shiller’s famous ratio [and how it is] assisting us in assessing current market conditions.
[The CAPE ratio is calculated in 6 steps as follows:]1. The first step in calculating the [CAPE] is to determine the nominator, which is the real price of equity markets.
For example, on 9/30/11, the S&P closed at a nominal value of 1,131. In our model, we express all values in terms of 2010 dollars (10/31/10), so we take today’s nominal S&P value of 1,131, and adjust it for inflation. The CPI was 218.7 on 10/31/10, but on 9/31/11 it stood at 227.2. Therefore in real terms, the S&P is at 1,089:
We can then use this methodology to calculate a real S&P close for every month going back to 1/31/1871.
2. The next step in calculating the [CAPE] is to determine the denominator.
First, we look at nominal earnings figures for the S&P. While the numbers have not been finalized, S&P currently estimates that on 9/30/11 the index’s trailing twelve months earnings per share for the overall S&P index were $88. That is to say, if you owned today’s index at $1,131, the earnings associated with that equity ownership interest would equate to $88, for a twelve month trailing nominal P/E of 12.9x earnings. You can go back in time and, for any given month in the history of the S&P, determine the trailing twelve months earnings figure for the overall index.
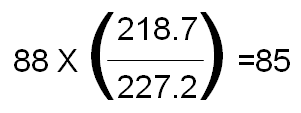
3. Now we adjust these figures for inflation, using the same methodology discussed above. So for example, for 9/30/11, we see the real earning for the S&P are:
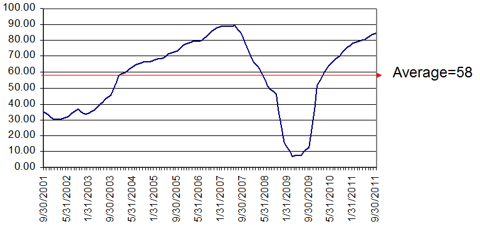
We can look at a stream of such monthly figures, each representing the 12-month trailing average real earnings for the S&P. Below is a graph showing this calculation for each month over the past 10 years:
Note that the average is $58. This is the “cyclical adjustment” in the calculation, which normalizes the gyrations in earnings figures apparent in the graph above. It is saying that, on average, the market has had real earnings of $58 per year in each of the past ten years.
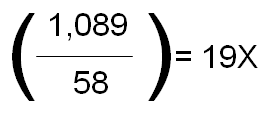
4. Now we can see that the cyclically adjusted real P/E [CA(R)PE] for the market is about 19:
How we apply Shiller’s CAPE Ratio
We hate to admit it, but bond folks are typically smarter than their equity counterparts. We may never reach their IQ level, but we can always borrow their ideas.
Who in the world is currently reading this article along with you? Click here to find out.
Here at Turnkey Analyst we prefer to look at earnings yield, or the reciprocal of the P/E, because it allows a more direct comparison with yields in other asset classes (real estate, fixed income, CDs, etc.). Looking at yields is also a more intuitive way of thinking about what you get when you purchase an asset. For example, I buy a popsicle stand at a 12% yield; I get 12$ for every $100 I invest. Whereas, “I buy a popsicle stand for a P/E of 8.33x” is less intuitive. Especially when I have to compare the popsicle stand to the treasury bonds paying a 5% yield.
How we create a predicted 10-year return figure
- Taking the reciprocal of the [CA(R)PE], above, we get a yield of 5.28%.
- Next, we go back and calculate a cyclically adjusted real yield for the market, using the methodology outlined above, for every month when 10 years of trailing data was available, which turns out to be back to 1/31/1881.
- Then we added one more piece of data. On the date of each calculation, we asked: What was the real return of the S&P, per year, over the subsequent 10 year period? This is an arithmetic average calculation. The latest period for which we know the full 10-year real return subsequent to an observation of the cyclically adjusted real yield of the market is 9/30/01. On that date, the S&P closed at 1,281 in real terms, and as we know on 9/30/11, the S&P closed at 1,089 in real terms so.
4. In the equation below, we want to solve…[the value of] r [so] we divide both sides by 1,281, take the 10th root of both sides, and subtract 1 from both sides:
We can see that the average yearly real return of the S&P from 9/30/01 to 9/30/11 was -1.6%. Now we have two variables:
- the cyclically adjusted real yield for any given point in time, and
- the subsequent 10 year real returns from that date.
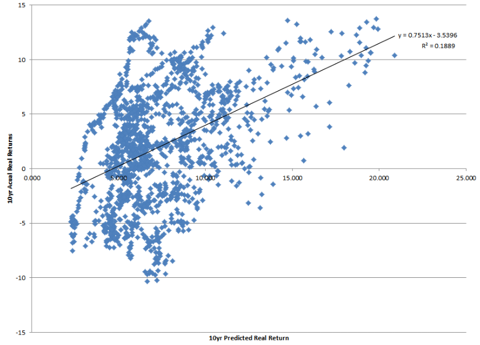
5. Now we want to see in what way the first variable is predictive of the second variable, so we run a regression on these two variables, using input from every year data is available (from 1/31/1881 through 9/30/2001), and solve for an intercept, A, and a slope, B, in the regression equation (Y) = A + BX. Below is the output for the regression:
The regression returns an intercept value of A=-3.54, and a slope coefficient of B=0.75. This means that for every 1.0 percentage point move in cyclically adjusted real yield, we see, on average, a 75bp move in predicted real S&P returns over the subsequent 10-year period.
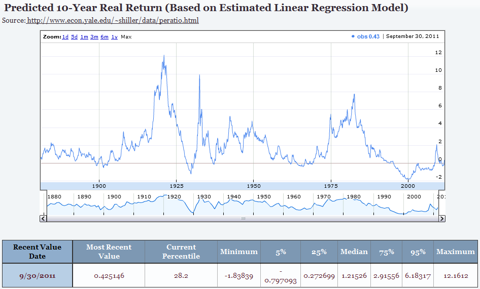
6. Now we are ready to take the final step and see what the regression model predicts for the S&P for the next 10 years. Recall that we have already calculated the current (9/31/11) cyclically adjusted real yield for the S&P above, and came up with 5.28%. Now we take: Y = -3.54 + 0.75 * 5.28, and solve for Y. In this case, Y = 0.43 (or if you take the regression inputs out several decimal places, 0.425146). This suggests that, based on our regression model, the stock market will see real returns of 0.4% per year for the next 10 years. Kind of makes TIPS look a little more appealing, no?
Reviewing the data above…we can see the Most Recent Value of 0.425146. This predicted return falls in the 28.2%ile of the predicted universe. You can also see minimum, median, and maximum predicted values, as well as several %ile breakpoints, for comparative purposes.
At the end of the day, the current cyclically adjust real yield of 5.28% is telling us that the stock market is expensive, at least by historical standards. This yield falls in the lower third of predicted states for the market’s value so it is quite possible that the stock market is not an especially good place to invest your money, at least at today’s prices.
Determining Opportunity Costs: 10-Year Equities Yield vs. 10-Year Treasury Bond Yield
Investing is all about opportunity costs…One of the metrics we like to look at is the inflation-adjusted spread between the 10-year earnings yield of the stock market compared to the 10-year Treasury Bond yield.
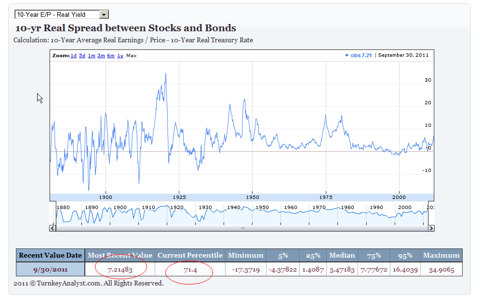
Currently, the inflation-adjusted 10-year earnings yield is 5.28% (previously discussed above) and the nominal 10-year treasury bond [yield] (as of 9/30/2011) is 1.98%. To adjust the nominal 10-year bond into real terms we simply take [(1+1.98%)/(1+CPI%)]-1. The 1-year CPI change from 9/30/2010 to 9/30/2011 was 3.99%, which implies the real bond yield is -1.94%. Putting this information all together, we identify that the real spread between earnings yield and bond yields is 7.22% [5.28+1.94], which is actually the 71st percentile based on history.
We have identified that predicted real stock returns are projected to be 43bp a year for the next 10 years according to a very simple linear regression model. [As such,] stocks seem expensive. We’ve also identified that relative to bonds, the real spread between stocks and bonds is 7.2% in terms of yields, i.e., stocks relative to bonds seem cheap.
Conclusion
If stocks are expensive, and stocks relative to bonds seem cheap, this implies that bonds are also expensive. Everything is expensive!
[As such, as we see it] the Fed is accomplishing its desired mission: keep interest rates low and force people into overpriced risky assets.
*http://seekingalpha.com/article/298115-shiller-p-e-suggests-low-returns-for-the-next-decade?ifp=0&source=email_macro_view
Related Articles:
1. Note: Current Cyclically Adjusted Price Earnings Ratio Says S&P 500 is Over-valued
The Cyclically Adjusted Price Earnings Ratio, abbreviated as CAPE, or the more precise P/E10, closely tracks the real (inflation-adjusted) price of the S&P Composite. After dropping to 13.3 in March 2009, the P/E10 has rebounded to 23.0. The historical average is 16.39 raising concerns about the current price level of the S&P Composite. Let me explain. Words: 1298
2. Any Way You Look At It the S&P 500 is Overvalued In Excess of 40%!
The S&P 500 is considerably overvalued – somewhere in the range of 34% to 61% – depending on which of 4 market valuation indicators are used and whether the valuation is based on the arithmetric or geometric mean of each. While these findings are not useful as short-term signals of market direction…they play a role in framing longer-term expectations of investment returns and suggest a cautious outlook and guarded expectations. [Here are the details.] Words: 676
 munKNEE.com Your Key to Making Money

