Back in the 1940s Donald Bradley developed a means to forecast the stock market using the movement of the planets which, according to the noted technical analyst William Eng in his book Technical Analysis of Stocks, Options, and Futures, is the only ‘excellent’ Timing Indicator. Below are current Bradley timing model charts indicating a major turning point in the stock markets is imminent.
The above comments are edited excerpts from an article* by Alex Bernal as posted on seeitmarket.com under the title Bradley Timing Model Indicates July 2014 Turning Point.
The following article is presented courtesy of Lorimer Wilson, editor of www.munKNEE.com (Your Key to Making Money!), and has been edited, abridged and/or reformatted (some sub-titles and bold/italics emphases) for the sake of clarity and brevity to ensure a fast and easy read. This paragraph must be included in any article re-posting to avoid copyright infringement.
Bernal goes on to say in further edited excerpts:
Bradley believed that the natural forces of the planetary cycles were the causation that affected the tides of men and there emotions and to that end he assigned over 190 numerical values to specific planetary constellations for every day, and then made a composite summation that became the siderograph, or Bradley timing model…
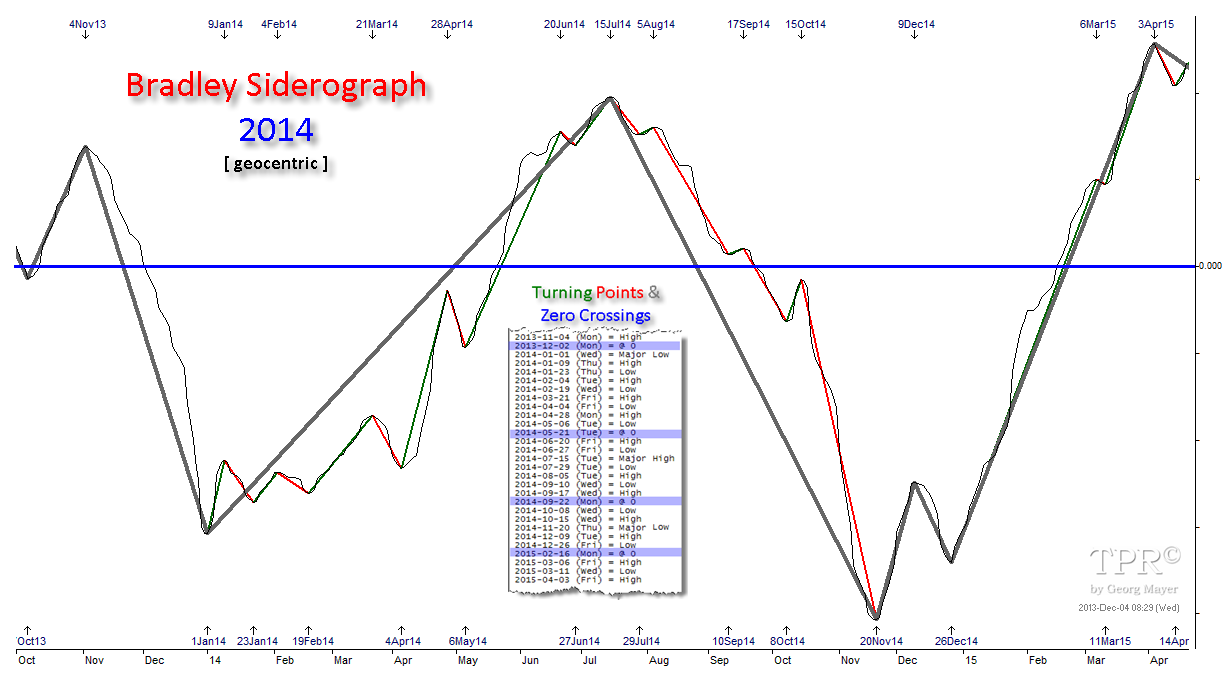
It is crucial to understand what the Bradley timing model is actually telling us since almost all traders (and even financial astrologers!) often misunderstand it. Over the decades it has been observed that the siderograph can NOT (!!!) reliably predict the DIRECTION of the market but only turning points (Major Trend Reversals) in the financial markets (stocks, bonds, bonds, commodities) within a time window of +/- 7 calendar days. Inversions (i.e. a high instead of a low and vice versa) are quite common especially during periods of Planetary Retrograde.
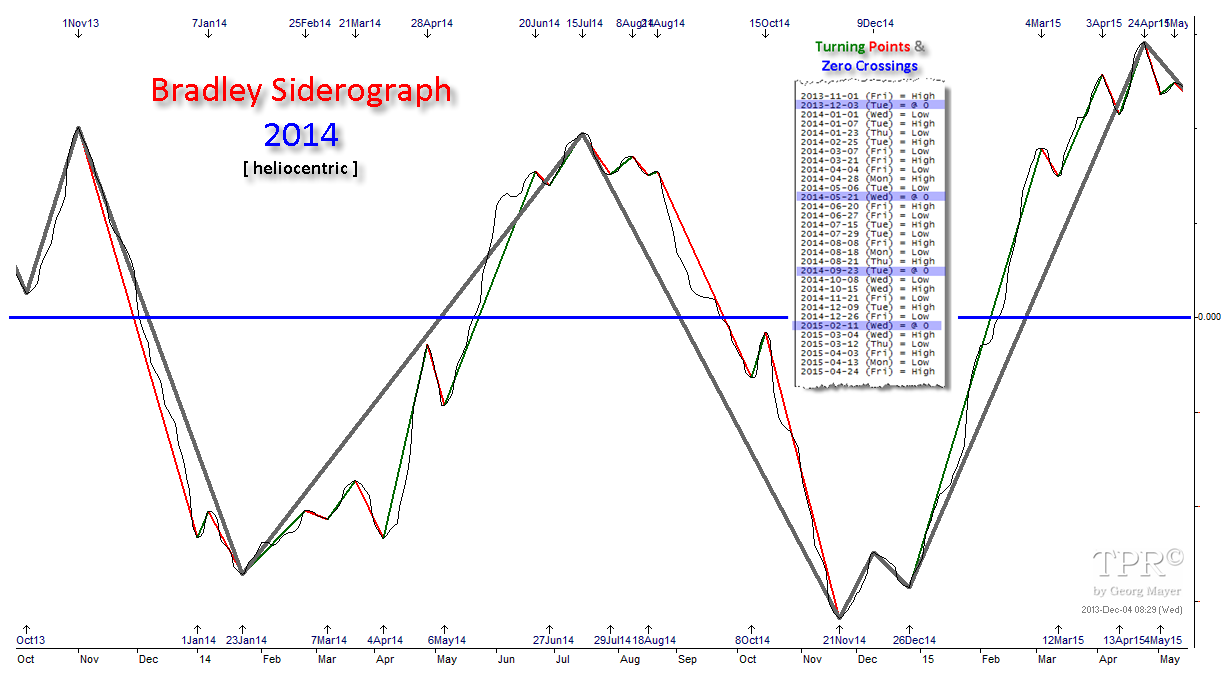
The siderograph can be computed in a Geocentric or Heliocentric aspects. My personal experience is that the Heliocentric model often is more accurate but when they both are in sync the effects are quite a bit more powerful.
Check out each of the Bradley timing model charts below:
Bradley Model – Geocentric
Bradley Model – Heliocentric
 Source: Time-Price-Research
Conclusion
[The above charts both suggest]…a large scale stock, bond and commodity index reversal around July 15.
*http://www.seeitmarket.com/bradley-timing-model-indicates-july-2014-turning-point-13666/
Editor’s Note: The author’s views and conclusions in the above article are unaltered and no personal comments have been included to maintain the integrity of the original post. Furthermore, the views, conclusions and any recommendations offered in this article are not to be construed as an endorsement of such by the editor.
Related Articles:
1. Ride the Market Waves With These 6 Momentum Indicators
It is hard to know what to buy or sell let alone just when to prudently do so. Thank goodness there are indicators available that provide information of stock and index movement of a more immediate nature to help you make such important decisions. This article describes the 6 most popular Momentum Indicators. If ever there was a “cut and save” investment advisory this is it! Words: 1234 Read More »
2. Time the Market With These Market Strength & Volatility Indicators
There are many indicators available that provide information on stock and index movement to help you time the market and make money. Market strength and volatility are two such categories of indicators and a description of six of them are described in this “cut and save” article. Read on! Words: 974 Read More »
3. Yes, You Can Time the Market – Use These Trend Indicators
Remember, the trend is your friend and now you have an arsenal of such indicators to make an extensive and in-depth assessment of whether you should be buying or selling. If ever there was a “cut and save” investment advisory this article is it. Words: 1579 Read More »
4. Don’t Try to Time the Market; Dollar-Cost Average Instead. Here’s Why
…Everyone is worrying that we are at or near a market peak and this has investors extremely hesitant to buy stocks for fear of a big decline or perhaps even a crash. Obsessing over the risk of a crash, however, could lead to analysis paralysis but there is a basic investing strategy that can save investors from losing too much hair as they make the decision to buy stocks. It’s called dollar-cost averaging. Let me explain how it works and why it’s great for investors with long-term investing horizons. Read More »
5. Market -Timing Pays BIG Dividends for Income Investors – Here’s Why
Many income investors have been taught to believe that “market-timing” is anathema to their investment objectives and/or that it can’t be done successfully… I will argue that this piece of conventional wisdom is false – dangerously false. In a three-part series of essays, I will argue that market-timing needs to be incorporated as a fundamental component of income investing. I will demonstrate why market-timing is important, when it should be applied and how it should be implemented. [Read on!] Words: 1956 Read More »
6. Stock Markets Look Ripe For a MAJOR Correction – Here’s Why
Divergences between fundamentals, confidence and the valuation of markets are large and, as such, cannot last for long. The only question is how – and how quickly – this correction occurs. Read More »
7. These 20 Cycle Theories Suggest Stock Markets, Gold & Bonds To Severely Correct
Unsustainable trends can survive much longer than most people anticipate, but they do end when their “time is up” – at the culmination of their time cycles…In an effort to bring clarity in how and when these trends could change direction we analyzed more than 20 different cycles. They almost unanimously point to tectonic shifts in the months and years ahead … starting now. We have been warned. At this point, we have enough confirmation to accept that the gold and silver crash – starting in April of 2013 – was the first shot across the board of what is to come. Read on! Read More »
8. Cycle Analysis Suggests S&P 500 Has Topped & Will Decline To Major Low In 2016
While the majority is looking at the Megaphone Pattern correction since the 2000 high and is expecting the market to go back to the lower trend line of this pattern and to make new lows, I think that it will not happen. The opinion of the majority can be used as a contrarian indicator. I think that a healthy correction in this new Secular Bull Market could push the Dow Jones to 12500-13500 (end of 2015 – half 2016) followed by a second leg up of this new Secular Bull Market. Read More »
9. Its Time to Stop Trying to Time the Market & Start Playing the Percentages – Here’s Why
Remember the game Musical Chairs? It seems that investors on Wall Street have been playing this game recently, as more and more we are seeing signs that the current bull market may be reaching its final stages. Each new sign that appears represents just one more chair being taken away from the game. The question investors need to ask is “where will I be when the music stops”? Read More »
10. Bubbles: Doing NOTHING Is Often the BEST Response – Here’s Why
The benefits of being able to detect a bubble, when you are in its midst, rather than after it bursts, is that you may be able to protect yourself from its consequences. [Below are possible] mechanisms to detect bubbles, how well they work and what to do when you think a particular asset is in one. Read More »


