The U.S. Treasury printed more than 3 times the face value in $100 bills compared to the total market value of all the gold produced in 2013 and, of course the U.S. Treasury is quite proud of this achievement as their website is called none other than: MoneyFactory.gov!
The above introductory comments are edited excerpts from an article* by Steve St. Angelo (srsroccoreport.com) entitled Hyper-Printing The $100 Federal Reserve Fiat Note vs Gold.
St. Angelo goes on to say in further edited excerpts:
The U.S. Department of Engraving and Printing issued more $100 Federal Reserve Notes in 2013 than in any year prior. Of course, part of the reason was due to the new $100 anti-counterfeit bill released in 2013, but the increased trend for the largest bill has been going on for decades.
This can plainly be seen in the graph below:
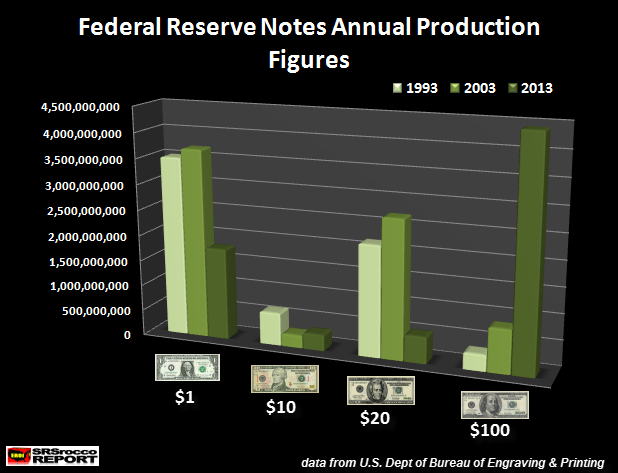
The chart also points out the obvious, who needs $1 bills anymore…LOL??
…In order to understand the huge leverage now in the U.S. Fiat Currency System, we need to look at the following table:
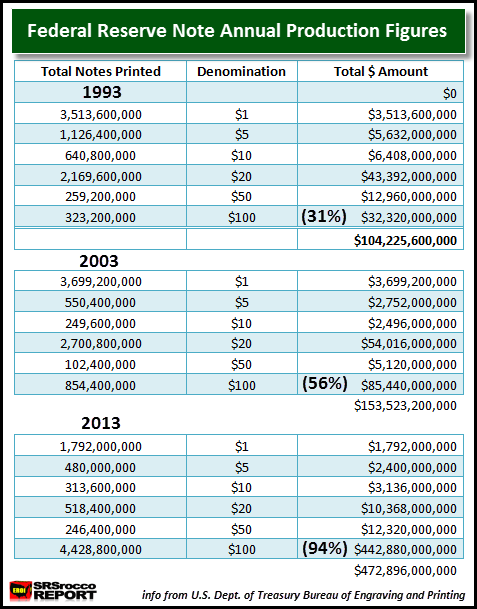
As I mentioned before, part of this huge increase in $100 bill printing was to exchange the old $100 bill with the new anti-counterfeit Federal Reserve Benjamin Franklin Note, but if we go back prior to the release of the new $100 bill, there were nearly 2 billion of the old $100 Federal Reserve Note printed in 2010. Thus, a total of $191 billion in $100 bills were printed in 2010, representing 80% of the $240 billion in total U.S. currency issued that year. This is up from the 56% ratio of total new currency supply in 2003.
$100 Federal Reserve Note Printing vs. Gold
To get an idea of just how much monopoly money the U.S. Treasury printed via its $100 Federal Reserve Note, take a look at the following chart:

The total face value of the $100 bills printed in 2013 amounted to $443 billion. Now, compare this to the total market value of all the gold produced in the world that very same year. According to GFMS 2014 Gold Survey, the world produced 3,022 metric tons [97.1 million troy ounces] of gold in 2013.
Doing some simple arithmetic…the average price of gold in 2013 (according to Kitco.com) was $1,411 an ounce and if we multiply it by 97.1 million oz, the total market value was $137 billion. That means the U.S. Treasury printed more than 3 times the face value in $100 bills compared to the total market value of all the gold produced in 2013 and, of course the U.S. Treasury is quite proud of this achievement as their website is called none other than: MoneyFactory.gov!…
One more interesting tidbit. According to the Federal Reserve, it costs 13.1 cents to print each $100 bill. Even though the total face value of the $100 bills printed in 2013 were $443 billion, the cost was just a mere $580 million… basically one-tenth of a percent of the cost of the face value.…
I would bet my bottom Silver Dollar that when faith in holding U.S. Federal Reserve Notes heads into the toilet, it would be much wiser to own REAL MONEY than the monopoly paper printed by the MoneyFactory.gov.
Editor’s Note: The author’s views and conclusions in the above article are unaltered and no personal comments have been included to maintain the integrity of the original post. Furthermore, the views, conclusions and any recommendations offered in this article are not to be construed as an endorsement of such by the editor.
*http://srsroccoreport.com/hyper-printing-the-100-federal-reserve-fiat-note-vs-gold/hyper-printing-the-100-federal-reserve-fiat-note-vs-gold/ (© 2014 SRSrocco Report. All rights reserved.)
If you liked this article then “Follow the munKNEE” & get each new post via
- Our Newsletter (sample here)
- Twitter (#munknee)
Related Articles:
1. A Close Look At the U.S. Dollar
The U.S. $1 dollar bill has been redesigned many time since first being issued back in 1862. What we almost exclusively use today is the version designed in 1963. The following extremely informative infographic explains what all the different symbols on the dollar mean, who is on the front & back of all the U.S. currencies currently in use and the $500, $1,000, $10,000 and $100,000 (yes, $100,000!) bills that are no longer in production. Read More »
2. Love Money? Then You’ll Find These U.S. Currency Facts VERY Interesting
Has U.S. currency as we know it today always been pretty much the same? The answer is no. If you love money as much as I do, you’ll love the infographic below and all the money facts it contains. Take a look. It’s very interesting! Read More »
3. An Inside Look At the U.S. Dollar Printing Process
Have you ever wondered how dollar bills are made, why currency is too hard to replicate? Check out the infographic below to learn about the process that goes into printing U.S. paper currency. Read More »
4. Which Is the World’s Safest Major Currency – You’ll Be Surprised
The term ‘safe fiat currency’ is as intellectually disingenuous as terms like ‘fair tax’ or ‘government innovation’ but, as we’ve been exploring recently why modern central banking is completely dysfunctional, it does beg the question– is any currency ‘safe’? Let’s look at the numbers for some data-driven analysis. Words: 575 Read More »
5. The History of Money – From Gold & Silver to Fiat Currencies
Today’s monetary system, combined with fractional reserve banking, has a lot of risks. It is vulnerable to bank runs, inflation, and economic bubbles, to name just a few, yet those risks remain invisible to the majority of people. This article provides links to a video and an extended report that provide insights into the question as to why today’s paper based money system is doomed to fail and how you can protect against such a collapse. Read More »
6. New Developments in the World of Money
Due to concerns about inflation and money printing, the last 20 years has seen an incredible number of new developments in the world of money. This infographic shows how gold got digital, how digital currencies exploded into life and who the key players are in this global story. Read More »
7. Fiat Currencies from Around the World: An Interactive Quiz
Paper money was first used by the Chinese during the Tang Dynasty in 806 AD–500 years before Europe began printing money in the 17th century. It would be another 100 years before America started circulating a national paper currency…. How familiar are you with banknotes from around the world? Read More »
8. Where Does Your Country’s Currency Rank?
Below is the list of the top 10 strongest currencies in the world, as measured by their percentage of the foreign trade market based on their combined interest in the world’s 3 foreign exchange markets. Read More »
9. This is the Most “Stupid” USD Chart Around – Here’s Why
You’ve almost certainly seen the chart below over the years – it shows the purchasing power of the US Dollar over time – and it looks terrifying. I call it the “stupid” chart, though, because it is a total misrepresentation of the facts because it isn’t telling the full story. Here’s why. Read More »
10. What the History of “World” Currency Likely Means for the U.S. Dollar – and Why
It’s common for the world’s most powerful country to issue a currency that becomes adopted around the world as the standard for international trade but whenever that country reaches a point of epic, terminal decline, and especially when it rapidly debases its currency, the rest of the world seeks an alternative. This article outlines the history of the rise & fall of “world” currencies over the centuries and then comments on what the future likely holds for today’s “world” currency – the U.S. dollar. Read More »