Below are 5 different takes on what we can expect to see for WTI crude oil prices from a fundamental perspective and from a technical perspective. The range is considerable – from as low as the $30s to Fibonacci projections as high as $93. Who’s right? You be the judge.
The first article by Markos Kaminis (wallstreetgreek.blogspot.ca),
the second article by Juan Eduardo Morales Veas (moneygreedandfear.com),
the third article by Gary Bourgeault,
the fourth article by Andrew McElroy, and
the fifth article by Nikhil Gupta
have all been paraphrased (i.e. edited and abridged) to provide you with a more succinct read.
1. A Fundamental Perspective – by Markos Kaminis
From a fundamental perspective there are 2 reasons that West Texas Intermediate (WTI) crude oil could go much lower – at least into the $30s per barrel, namely:
- The latest (September) Oil Market Report from the International Energy Agency (IEA) states that global oil demand is slowing at a faster pace than previously predicted and that the current glut in supply will continue through 2017 with no recovery until 2018. Indeed, with OPEC unwilling to cut production and the world’s economies in stall mode, crude oil prices have no where to go but DOWN.
- A Fed interest rate hike next week would weigh against crude oil prices in 2 ways:
- As the dollar strengthens, crude oil, priced in U.S. dollar terms, would get cheaper.
- A rate hike would put pressure on economic activity and could raise more doubts about U.S. economic growth expectations and, as such, impact oil demand expectations and prices.
The most recent negative IEA Oil Market Report outlook for crude oil demand over the next 2 years, or more, and, additionally, the resultant affect any rate increase would have on the U.S. economy, the USD and the price of crude oil, suggests that we could very well see $40 per barrel in the very near term and a look into the abyss of the $30s not long thereafter. Indeed, if the Fed does raise interest rates, we could well see a much faster pace of decline. Time will tell.
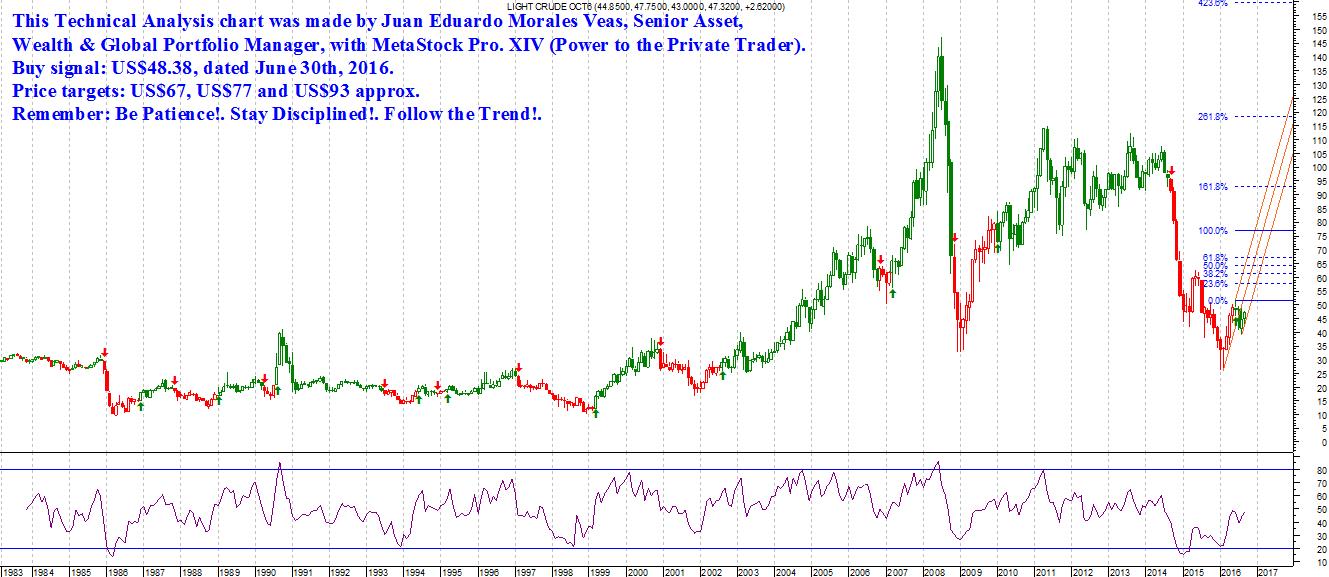
2. A Technical Perspective – by Juan Eduardo Morales Veas
This technical analysis sees the crude oil picture very differently.
Juan Eduardo Morales Veas’ latest Fibonacci projections (see chart below) suggest that crude oil is going UP with price targets of $67/bl., $77 and $93 depending on the time period involved.
3. Another Fundamental Perspective – by Gary Bourgeault
The key to understanding the price range oil is moving in is to filter out all the media noise and objectively look at the fundamentals of the industry and, at this time, those fundamentals scream a low price, and no amount of positioning and “verbal intervention” should move investors off of that realty.
With numerous headwinds confirming that thesis, the only thing that could counteract it would be for global demand to surge beyond expectations. The fact is, however, that is not going to happen – the pace of global oil demand is slowing down, not speeding up – as a consequence, primarily, of slowing economies.
Soaring supply and rising inventories also point to a prolonged period of low oil prices, which when accompanied by slowing demand growth, leaves little in the way of tailwinds for oil. There is nothing in the outlook suggesting this will change through the end of 2017.
In addition, as the U.S. shale industry is today, even if global demand for oil were to pressure supply, it can quickly ramp up production and step into the market. That could easily offset demand growth, which would continue to keep the price of oil from taking off. That ties the hands of major competitors like OPEC, Russia and Norway, which have no way of influencing the price of oil as they have done in the past. All OPEC can do is keep oil supply at high levels in order to slow down the U.S. shale industry.
A large number of pundits have asserted that the oil market has rebalanced but that is simply not true. Global oil demand estimates are being downwardly revised, with the general consensus being that for the remainder of 2016 it’ll drop to a growth pace of 1.3 million barrels per day, and for 2017, fall to 1.2 million barrels per day. This is happening while a number of OPEC suppliers are operating at or near historical highs, with a lot of oil being close to being brought back to market, including Iran, Nigeria and Libya. That will add hundreds of thousands of oil to the market on a daily basis, which when combined with existing supply levels, is sure to put downward pressure on oil for a prolonged period of time, or at least keep it from rising in any meaningful way.
I see no rebalancing by the end of 2017, and am not sure it’ll even happen in 2018, although I consider that an uncertainty because too much could happen during that lengthy period of time. My thesis in that regard is the global economy is going to continue to slow down, and we’re likely to see the pace for the demand for oil to continue to decline as it does. Eventually we’ll face another recession, which will expedite the process of falling global demand for oil.
Taking into account the major factors mentioned above, I see oil continuing to operate in a range of $40 to $50 per barrel, with the occasional excursion below and above that range.
That being said, I see oil almost certainly dropping into the $30 range once again, probably in the very near term, as the dead cat bounce fades away. How far down into the $30s it’ll drop is debatable, as it’ll depend on how supply, demand and inventory play out going forward, as well as the impact the increase in rigs will have on the minds of investors. Once this downward move happens, I see the price of oil rebounding to the range already mentioned, and remaining in it for the next 16 months at least.
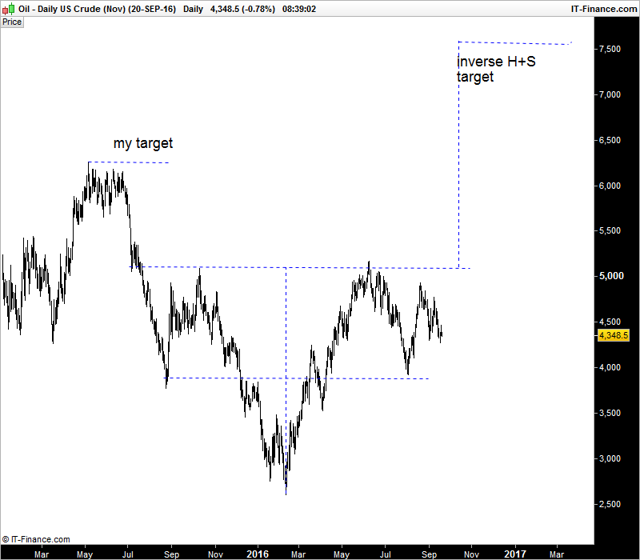
4. Another Technical Perspective – by Andrew McElroy
My approach to trading oil is 90% based on technicals and sentiment. My fundamental analysis only attempts to set context for my technical analysis. I want to describe the market in words as well as in lines and patterns. What is the oil market doing now, and why?
…The key takeaway for me is not to bother too much with the noise of inventories and OPEC. Once the overhead supply is diminished, oil should move higher.
…[Rather, from a technical perspective,] the inverse head and shoulders is quite a symmetrical and well formed pattern, (although I prefer to have the neckline sloping downwards as part of a channel)…[and it] projects a target of $75 once active above $51. My target is more conservative at $62.5. I am merely including the chart here as a technical review would be incomplete without it.
Oil has been trading a range for the last few months and it has been hard to make sense of the price action or fundamental drivers such as supply and demand…[but it is now] testing a trendline. This may seem important, but the probabilities of it holding are not too good. A break and sharp recovery is actually more bullish than a few small bounces. I will add to my longs if I see a short term capitulation move below $43. My stops remain below $39.
5. Yet Another Technical Perspective – by Nikhil Gupta
The chart below indicates that price action in crude oil is shaping into an Inverse Head & Shoulders technical pattern – a bullish pattern marking a reversal. For an easier understanding, I have marked and named all the important technical points.
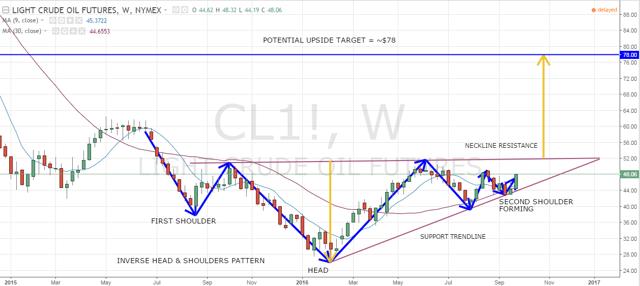
Source: TradingView
Crude oil is receiving strong buying pressure along the upward sloping support line while it faces selling pressure near the neckline resistance. The range is contracting, and therefore, a breakout is bound to happen. If the oil market begins to anticipate a failed deal in November, the breakout on the upside will take longer to happen. Getting some big players like Russia on board to a production freeze or a cut could lend serious momentum to the upsurge, and cause the price to pierce the resistance zone of $50-$52.
While fundamentally it is tough to call for a target price, technicals suggest that the commodity could aim for $80 in a bullish scenario. The expected timeframe for such a result would be between 1-2 years. The call for $80 now seems very surreal but, since the markets are forward-looking, they may be anticipating some events which we currently have no idea about.
Longs are advised to hold on to their positions by maintaining a tight stop-loss just below the support line (on a closing basis). The commodity will face renewed selling pressure near $52, but it may be short-lived this time.
Conclusion
Who’s right? You be the judge. Share your opinion/analysis with us in the comment section below.
Follow the munKNEE – Your Key to Making Money! “Like” this article on Facebook; have your say on Twitter; register to receive our bi-weekly Market Intelligence Report newsletter (see sample here , sign up in top right hand corner)