Is this a bubble waiting to burst or what? Count on 2017 marking the beginning of the greatest crash we’ve seen since 1929-1932. Here’s why.
The comments above and below are edited ([ ]) & abridged (…) excerpts from an article by Harry Dent (EconomyAndMarkets.com) to provide a faster and easier read.
…We’ve been on a debt spree since the early 1970s when we went off the gold standard, covering every possible angle:
- trade deficits,
- government deficits,
- unfunded entitlements,
- private debt,
you name it! Our total debt has grown 2.5-times GDP since 1971. How could economists not see this as a problem? How is this the least bit sustainable? It isn’t.
We’re hurdling toward a massive financial crisis, and all we have to show for it are financial asset bubbles destined to burst, and when they do, they’ll wipe out the artificial wealth they’ve created for many decades in just a few years, as they did from late 1929 into late 1932!
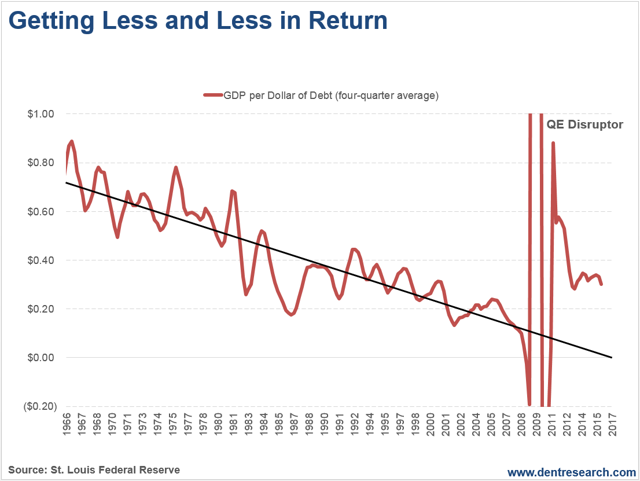
The chart below shows the common-sense truth.
As with any drug — and debt is a financially enhancing drug — it takes more and more to create less and less of an effect. Eventually, you reach the “zero point” where there is no effect and the drug kills you from its very strain and toxicity. We’re rapidly approaching that zero point, after every dollar of debt has produced less and less GDP steadily since 1966:

e that the anomaly in the chart after 2008 was due to the impact of unprecedented QE. Ever since that disruption, the trends have pointed back down — making a beeline toward that zero point again.
Back in 2002, Swiss investor and market prognosticator Marc Faber published a similar chart. His findings showed the zero point for debt creation would occur around 2015. With updated data, we now see that the zero point will hit around the beginning of 2017. In other words — right about NOW! This is why central banks around the world have failed to…[create] inflation despite endless money-printing. The more money they print, the less effect it has…
When central banks create money out of thin air – through the fractional reserve banking system and through QE – it has to go somewhere. [However,] when the economy is so indebted that consumers and companies can’t take on any new debts, the money can’t go there so it winds up going into financial speculation, especially as investment firms can lever up at little cost due to zero or negative interest rates. Stock prices bubble instead of inflation as the economy keeps sucking wind!
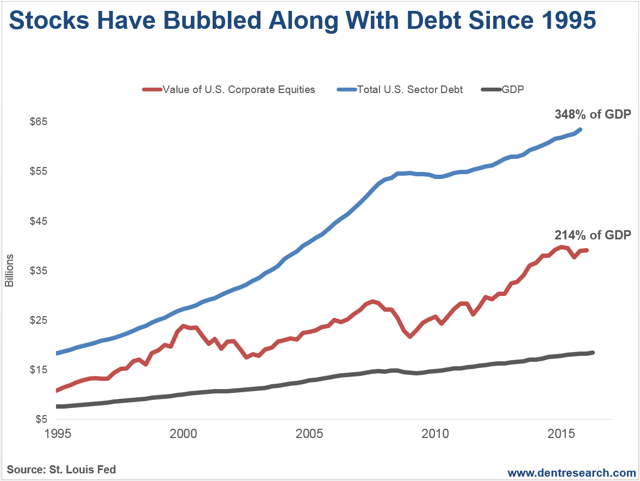
Sure enough, this next chart shows that debt and equity prices go hand-in-hand:

In the 20 years between 1995 and 2015, debt grew at a rate of 4.2-times GDP, and stock prices followed at 4.3-times. Total U.S. sector debt now stands at 348% of GDP, with stocks at 214%. All told, these two combined are 588% of GDP, far more than any time in history. Is this a bubble burst waiting to happen or what?
Count on 2017 marking the beginning of the greatest crash we’ve seen since 1929-1932…
Disclosure: The above article has been edited ([ ]) and abridged (…) by the editorial team at  munKNEE.com (Your Key to Making Money!)
  to provide a fast and easy read.
“Follow the munKNEE” on Facebook, on Twitter or via our FREE bi-weekly Market Intelligence Report newsletter (see sample here , sign up in top right hand corner)
Links to More Sites With Great Financial Commentary & Analyses:
ChartRamblings; WolfStreet; MishTalk; SgtReport; FinancialArticleSummariesToday; FollowTheMunKNEE; ZeroHedge; Alt-Market; BulletsBeansAndBullion; LawrieOnGold; PermaBearDoomster; ZenTrader; EconMatters; CreditWriteDowns;
 munKNEE.com Your Key to Making Money
