The S&P500 is likely to achieve a secular (long term) peak this month, then drop to the 500s by July-August 2013. This article explains why. Words: 1803
So says Greedometer (www.TriWealth.com) in edited excerpts from his original article* as posted on Seeking Alpha under the title The Rats Are Jumping Ship: Welcome To The Top Of The Stock Market.
Lorimer Wilson, editor of www.munKNEE.com (Your Key to Making Money!), has edited the article below for length and clarity – see Editor’s Note at the bottom of the page. This paragraph must be included in any article re-posting to avoid copyright infringement.
The article goes on to say, in part:
Insider Selling to Buying Ratio at All-time High!
Two weeks ago, the ratio of corporate insider selling to buying exceeded 8:1 — an all-time record. In fact the 5-week period ending 2 weeks ago saw the highest ratio of selling to buying ever.
When corporate insiders are panic selling – and that’s what this is – frequently what follows is a peak in the S&P500 within a month or two, then a collapse. Intuitively, this seems unsurprising because if someone’s going to have a good read on earnings prospects for the next several quarters, it would be C-level executives. When an earnings picture is weak, usually C-level execs provide guidance that is muddy or foggy. If they were to provide the same assessment that led them to dump their own shares, the stock price would get hammered…Thus, for obvious and unflattering reasons, I refer to this type of scenario (insiders panic selling but providing foggy earnings guidance before a stock market collapse) as ‘the rats jumping ship’.
The Top of the Market is In!
Let me put some more meat on the bones for my dire and explicit stock market collapse. Between now (October 5th 2012) and mid-January 2013, we’ll see volatility, but likely end up within 50 points of today’s S&P500 close (1460). In other words, this is what the top of the US stock market looks like – and there’s a long way down.
You Can Not Say “No One Saw It Coming”
If you manage people’s money for a living, it’s never a good time to proclaim you are convinced the stock market is on the verge of taking an epic drop. Your clients might leave, putting their assets into CDs earning 0.5% until the storm blows over. Or worse, your analysis could be correct, but an intrusion by the Fed (or ECB) prevents the stock market collapse you identify and prepare for (say by going short). To many, it won’t matter that the Fed/ECB action validates your analysis. They’ll label you a perma-bear. On the whole, your investment management business will be less likely to lose clients if you ride along (oblivious to the building peril) on the way up, then claim ‘no one saw it coming’ on the way down.
Applicaion of Risk Detection Algorithms
This article is going to make it clear that before the S&P500 melted down previously, there were some very clear warning signs – and those same signs are flashing now.
These warning signs are prone to false alarms, so I have combined them into two algorithms with the express purpose of maximizing warning effectiveness and minimizing false alarms. Each of the two algorithms has an output gauge that represents risk.
- One algorithm is designed to be a strategic indicator i.e., to warn when the S&P500 is at a secular (multi-year) top. This gauge is called the Greedometer [see here for a full explanation and an interactive Greedometer]. It is fairly coarse in terms of precision, only able to identify a peak or trough to within 3-4 months.
- The second algorithm is designed to be more fine-tuned and able to distinguish to within 2-3 weeks. This algorithm is represented by a gauge called the mini-Greedometer.
The two gauges are used to present a view regarding risk to the S&P500. Note, the price of the S&P500 is not an input.
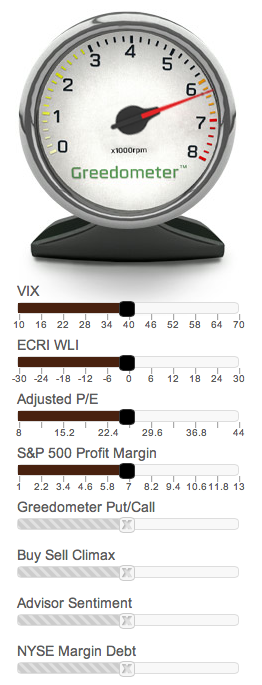
I am anticipating the strategic Greedometer gauge will reach the crucial red-line level imminently (7000rpm on the gauge). [Every time the Greedometer registered 7000 rpm or higher, a major stock market crash followed. There have been no false alarms. Equally helpful, no major stock market crashes occurred without the Greedometer redlining (since 1999).] Let’s examine the inputs to the algorithm and see why that is.
The 8 Inputs to the Strategic Greedometer Algorithm
There are eight inputs to the strategic Greedometer algorithm. They’re shown in the figure below. (The image is a partial screen shot of the interactive Greedometer gauge on my website (see here). The top 4 inputs are adjustable, which is why they appear different than the bottom 4.)
The experienced investor will be familiar with most of the Greedometer inputs:
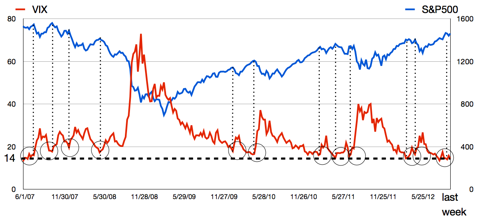
1. VIX: Popularly known as the fear gauge, the VIX (volatility index) provides a measure of investor sentiment towards the stock market. It ranges from extreme levels of fear (high VIX readings near stock market bottoms), to extreme levels of complacency (low VIX readings near stock market tops).
On Friday, the VIX dropped under 14 — an exceptionally low reading showing fear has taken a holiday. A necessary ingredient for a secular stock market top.
2. ECRI WLI: The Economic Cycle Research Institute (ECRI – www.businesscycle.com) Weekly Leading Indicator (WLI) is an excellent proxy for US GDP growth. Ordinarily GDP growth rates peak and roll over approximately 3-6 months prior to the stock market peaking and initiating a collapse. Our most recent peak in GDP growth was a +4.1% annualized rate in 4Q 2011.
Right on time, the US stock market peaked in April and was on the verge of beginning a second leg down when the ECB’s threats paused the collapse. The Fed piled-on with QE3 last month for good measure but the sugar-rush effects of monetary policy are once again wearing off.
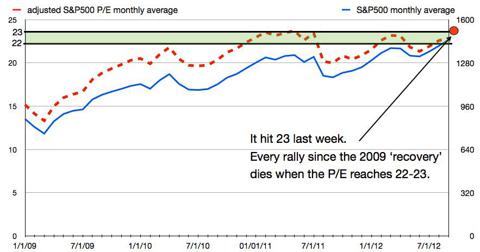
3. S&P500 Adjusted P/E: Secular stock market tops always see high P/Es, reflecting that stocks are over-priced. Last week saw the adjusted P/E (on the S&P500) touch 23 again (link to chart).
No stock market rally since the 2009 bottom has managed to survive long – much less exceed – 23. The long term mean is 16.4, so 23 is a 40% premium.
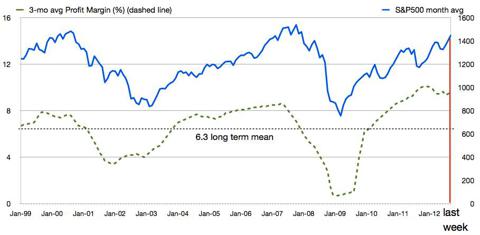
4. S&P500 Profit Margin: It should not come as a surprise that secular stock market tops also see a peak in profit margins. Usually profit margins peak one or two quarters prior to a secular stock market top. The all-time peak in S&P500 profit margin was 4Q 2011 through 2Q 2012. Weekly readings reached 12% early in earnings season when fat-margin banks report, and have finished each of those quarters with a 9%+ profit margin. The long term mean profit margin is 6.3% so again we’re looking at a very high premium.
3Q earnings season kicks off October 9th. By mid-November most companies will have reported. Profit margins for the entire quarter are likely to drop to an 8-handle. I submit, they’ll probably drop to the 3.5% range by next summer.
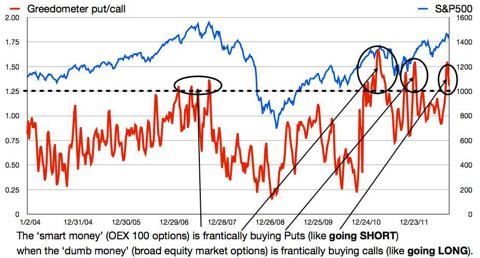
5. Greedometer Put/Call: This input parameter is slightly more complex that the others. The Greedometer Put/Call ratio is the difference in readings between the Put/Call ratio on the OEX 100 (largest 100 publicly traded US stocks) and the Put/Call ratio on the total US stock market. This spread highlights the divergence in actions taken between those that use options on the OEX options market with those that use options on the broad equity market.
The OEX 100 index is highly correlated with the total equity market, but sometimes the options activity on these two markets diverge. It turns out there is a markedly higher proportion of retail / small investors using options on the broad equity market than with the OEX 100. When there is a large divergence in readings, the investors betting with the OEX are right a lot more than they’re wrong.
Prior to and at secular stock market peaks, the Greedometer Put/Call value rises considerably. This reflects retail investors loading up with Call options at the stock market top while hedge funds and others are loading up with Put options. Last month the spread in the Put/Call ratio on these indexes was very high i.e., the OEX 100 options buyers were very bearish while the broad equity market options buyers were very bullish.
6. Buy Sell Climax: A Buy climax identifies weeks where very large numbers of US stocks reach a 52-week high but close lower in price for the week (suggesting a stock market top). A Sell climax is the opposite.
Buy and sell climax readings have been very low lately. I would expect a very high buy climax reading within the next 2-3 weeks, suggesting a secular market top has been seen.
7. Advisor Sentiment: When very high proportions of brokers and advisors have the same view, they’re usually collectively wrong. Every major stock market top saw extremely high ratios of advisors with bullish views vs bearish views. The past few weeks have seen high advisor sentiment readings (more than 2 bulls per bear).
I would expect the reading to climb higher this coming week and keep climbing to exceptionally high readings (approaching 3:1) if there is any appreciable gain in the S&P500.
8. NYSE Margin Debt: This is the amount of money owed to broker-dealers by investors placing speculative bets ‘on margin’. Greed incarnate.
September’s NYSE margin data won’t be available until near the end of October, but I expect it will show a sizable increase to one of the highest readings since the 2009 bottom. Widespread stock market greed is a necessary ingredient for a secular market top.
There you have it. A walk-through of the Greedometer, and an application with current data.
Can We Expect Further QE?
This exceptionally dire baseline forecast can only be paused by new and larger efforts from the Fed, ECB (European Central Bank), and/or PBOC (People’s Bank of China). Perhaps that will materialize again.
Europe: However, if you saw last week’s European inflation data, it is clear Europe is hitting the point of diminishing returns from the ECB euro currency printing press because even amid recession, inflation is creeping up, and it’s not being driven by demand.
U.S.: Here in the US, QE2 took the US inflation rate from roughly 1% to nearly 4%. Since QE2 ended, inflation has been falling, but QE3 may rekindle inflation once again. Indeed, inflation’s corrosive characteristics are almost certainly the principal reason QE3 is half the size of QE2 i.e., $40B/month in new printing vs $80B.
China: I can’t comment on the veracity of Chinese inflation data, so I’ll leave it alone.
On the whole it seems the global economy is running out of monetary policy steroids that don’t come with equally painful side effects. I would not count on central banker actions stopping these economic collapses many more times. Perhaps not at all.
Conclusion
I have no interest in scaring investors. I don’t sell gold or annuities. I do macroeconomic as well as fundamental and technical market research (going back nearly 14 years), and have combined this research into two proprietary algorithms that represent US stock market risk.
When the Greedometer redlines (exceeds a reading of 7000), the S&P500 peaks shortly thereafter, then begins to collapse. The gauge has been very close to 7000 over the past couple weeks, and I suspect will crack the 7000 barrier within the next two.
*http://seekingalpha.com/article/912501-the-rats-are-jumping-ship-welcome-to-the-top-of-the-stock-market
Editor’s Note: The above post may have been edited ([ ]), abridged (…), and reformatted (including the title, some sub-titles and bold/italics emphases) for the sake of clarity and brevity to ensure a fast and easy read. The article’s views and conclusions are unaltered and no personal comments have been included to maintain the integrity of the original article.
Related Articles:
1. A Massive Stock Market Crash Is Coming!
In the financial world, the month of October is synonymous with stock market crashes. So will a massive stock market crash happen this year? You never know. Hopefully we’ll get through October (and the rest of this year) but, without a doubt, one is coming at some point. The truth of the matter is that our financial system is even more vulnerable than it was back in 2008 and, as such, many financial experts are warning that the next crash is rapidly approaching and that those on the wrong end of the coming crash are going to be absolutely wiped out. Let’s take a look at some of the financial experts that are predicting really bad things for our financial markets in the months ahead. Words: 1634
What’s the first thing that comes to mind when investors hear the word October? Ghoulish Halloween costumes? Nope. Memories of World Series heroics from slugger Reggie Jackson, better known as Mr. October? Nope. Stock market crashes? Bingo! Words: 1477
3. Current Market Overvaluation (from 33% – 51%!) Suggests Cautious Long-term Outlook
Based on the latest S&P 500 monthly data, [my analyses indicate that] the market is overvalued somewhere in the range of 33% to 51%, depending on which of 4 indicators I used. This is an increase over the previous month’s 31% to 48% range. [Let me explain the details.] Words: 475
4. Goldman Sachs: The Fiscal Cliff Is a Real & Present Danger to Future Level of S&P 500 – Here’s Why
“Portfolio managers have been swayed by hope over experience” when it comes to anticipating the effects the fiscal cliff will have on markets. Investors aren’t giving as much attention to the fiscal cliff as they should be, and that may be helping to set the markets up for a repeat of last year, when the debt ceiling negotiations sent stocks plummeting.
5. I’m Worried About the Likelihood of a Sharp Market Decline This Fall – For These Reasons
6. These 6 Factors Suggest Avoiding Equities in the Foreseeable Future


7. Consumer Discretionary Stock Performance Key to Market Direction – Here’s Why


8. Harry Dent Sees Dow 3,000; Seth Masters Sees Dow 20,000! Who’s Most Likely Right?


 munKNEE.com Your Key to Making Money
