We look at this market and we see “too much.” Too much divergence, too much complacency, too much embedded downside risk…the list goes on and covers many things. Let’s make the rounds and see what we find [and what it means for the immediate well-being of the various stock markets.]
The above introductory comments are edited excerpts from an article* by Mercenary Trader (mercenarytrader.com) entitled Too Much!
The following article is presented courtesy of Lorimer Wilson, editor of www.munKNEE.com (Your Key to Making Money!) and has been edited, abridged and/or reformatted (some sub-titles and bold/italics emphases) for the sake of clarity and brevity to ensure a fast and easy read. This paragraph must be included in any article re-posting to avoid copyright infringement.
The article goes on to say in further edited excerpts:
1) Too much asset class divergence
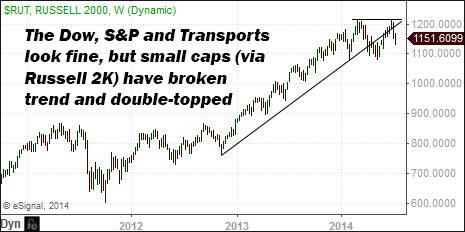
Most of the major indices (DJIA, SPX, TRAN) are at, or near, their all-time highs…but small caps, as shown via the Russell 2000 (RUT) below, have broken trend and potentially-double topped. This is not a sign of roaring risk appetite. If anything it is a clear sign of the direct opposite, as capital rotates into “safer” areas of the market like consumer staples and utilities.
- Does Size (Market Cap) Matter?
- Bigger IS Better! What Does This Selective Advance Mean For the Stock Markets Going Forward?
- Size Does Matter: A Look at Market Capitalization and What It Means for Investors
When a long-only money manager fears the market and wants to go to cash, he is often restricted by fund parameters, and thus seeks out conservative market sectors instead – areas that serve as a proxy for cash. If risk appetite were alive and well, small caps would be in far better health.
… High yield debt, even more so than small caps, is a “canary in the coal mine” for risk appetite. The high yield debt ETF (NYJNK), went into waterfall decline this past week. As a result, JNK is near its first 20 / 50 day downside cross in a year (from June 2013.)
(click to enlarge)
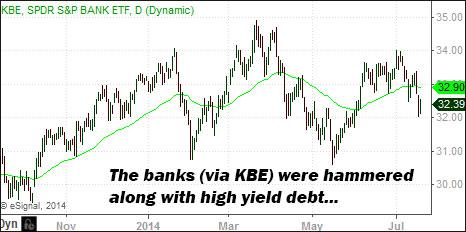
The banks, too, are looking less than bullish. The SPDR Bank ETF (KBE) and S&P Regional Banking Index (KRE), saw harsh declines last week with no Friday bounceback to speak of…This is not what one would see if all were hunky dory.
The euro (EURUSD) offers another bearish milestone. EURUSD, as you can see via the moving average chart below, has completed its first 20/200 downside cross in over a year.
The euro itself is testing long-standing support in the $1.35 area, and the 200 day EMA (red line) is flattening out and potentially ready to decline. This fits with the observation that Europe itself is in quite a lot of trouble… It will become apparent, sooner or later, that Europe never actually solved its most deadly serious debt and currency union problems, but only “kicked the can down the road” a bit. This realization will hit home as the implications of a Federal Reserve tightening/hiking cycle – not seen since the mid-2000s – provides a powerful tailwind for the U.S. dollar in a global “risk off” environment, even as now-declining European equities get dumped. Add it all up and EURUSD is going to make for one hell of a fantastic short. (We are currently short from 1.3599.)
(click to enlarge)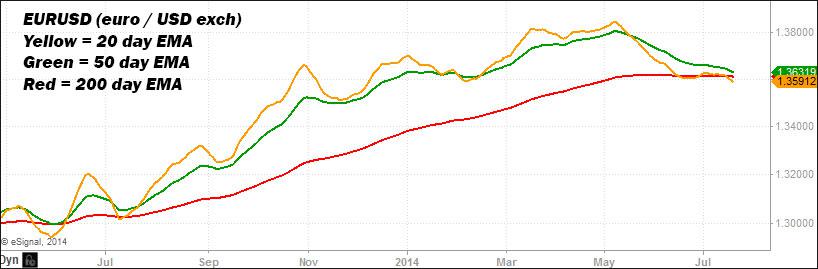
Among tech stocks the same basic pattern applies. Love and devotion are flowing to big, lumbering beasts like Microsoft (NASDAQ:MSFT), where investors cheer the slashing of 18,000 jobs, even as the Dow Jones Internet Index (FDN) threatens 50 EMA submergence after a volatility-expanding trend break.
2) Too much Federal Reserve trouble
Janet Yellen did something very interesting, and highly non-characteristic of a Fed Chief, last week: She called out specific areas of the market as overvalued saying: “stock market valuations for small firms, social media and biotechnology firms “appear to be stretched. Meantime risk spreads on corporate bonds have reached all-time lows, a sign of over-valuation…” No wonder small caps, biotech, high-yield credit and the like got whacked. The last time a Federal Reserve chairman made valuation comments this pointed was arguably 1996, when Greenspan gave his famous “irrational exuberance” speech (prior to backing off completely and becoming the world’s biggest cheerleader).
Why would Yellen pour cold water on the hottest areas of the market? From a game theory perspective, the Fed is walking a tightrope of managed expectations. They do not want panic or a market crash, which would negatively impact the fragile economic recovery. On the other hand, [however, neither]…do they want extreme speculative “froth,” lest the market fall too hard on the inevitable return of interest rate hikes.
Among Yellen’s fears is the possibility of brutal market decline when rate hikes finally arrive and, thus, by telegraphing danger signals ahead of time, there is hope of easing the transition a bit. To put it another way, Yellen foresees the potential of an accelerated timetable for “taking away the punchbowl” – as she also openly hinted this past week – and is trying to give…[those at the party] a heads up. Dear speculators: Don’t say she didn’t warn you.
Other Fed hawks are loudly clearing their throats. Consider the following, for example, from Esther George, of the Federal Reserve Bank of Kansas: “Today’s economy, with a strengthening labor market and rising inflation, is ready for a more normal rate environment. Waiting too long may allow certain risks to build that if realized, could harm economic activity without room to adjust rates in response.”
For years now, bulls have loved to quote the maxim “Don’t Fight the Fed” in justifying their perpetual optimism. Will they remain consistent with their own pacifist advice, now that the Federal Reserve is talking down stock valuations and talking up rate hikes (in the most literal sense of the term)?
3) Too much M&A Froth
The “big deal” of the week (pun intended) was Rupert Murdoch’s $80 billion bid for Time Warner (NYSE:TWX). Murdoch’s last major acquisition was Dow Jones in 2007, for the relative pittance of $5.6 billion. The TWX bid is more than fourteen times larger (and could grow larger still, as the original offer was rejected and handicappers reckon Murdoch could pay more).
Comparisons with 2007 keep popping up over and over again, and not in a good way. As the WSJ reports: “A $54 billion pharmaceutical tie-up announced Friday is the latest in a string of big mergers that has pushed deal activity past the $2 trillion mark this year, growing at a pace not seen since (guess when) 2007.”
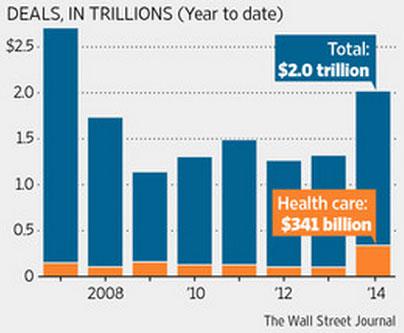
Many of these deals are offshore tax related, the WSJ goes on to report, as large global healthcare players merge with foreign partners to shift their tax jurisdiction away from the United States. “Unsolicited bids at $444 billion this year,” the WSJ further notes, “are at their highest point at this point in the year since Dealogic began keeping records in 1995.”
Famed quant investor Jeremy Grantham believes conditions are in place for an M&A mega-bubble which is just getting started. “Don’t tell me there are already a lot of deals,” he says in his latest quarterly letter. “I am talking about a veritable explosion, to levels never seen before.”
Grantham makes this prediction based on cheap debt (the currency which makes deals happen), high corporate profit margins (which are expected to persist), and a “young-looking recovery”(even though it is six years old). Grantham further notes that investors are “just picking up their courage” and that there is slack in the labor market and room for capital spending.
We certainly respect Grantham, but see many reasons to be skeptical of this “super boom” M&A call:
- Cheap debt conditions have been with us for years and the impact of that cheap debt has also been felt for years…
- The cheap debt bonanza is now in peril on multiple fronts. We are seeing real and early deterioration in high yield debt – note junk bonds breaking down this past week, and bank troubles in Europe the week before that…
- It is not as if the Federal Reserve is giving a “carry on and continue speculating” green light. If anything the Fed is giving the exact opposite: An end date for the taper has been set (roughly speaking October); Yellen herself has been talking down valuations and hinting at accelerated rate hike risks to gut check speculators; and other Fed hawks have been advocating rate hikes sooner rather than later with increasing verbal aggressiveness. The train has been rolling for five-plus years. The engineers are now showing every sign of throwing the brakes. This, again, is not an environment where the cheap debt bonanza continues.
- Low volatility is another late-cycle factor widely cited in driving the deal boom. “If you look back two years ago, there were wild swings in the markets making it very hard to do deals,” the global head of M&A at Morgan Stanley tells the WSJ. “Now the equity markets go up and down but not with great volatility.” How long is that going to last, however? We have already seen the longest low-volatility stretch in decades with reason for the trend to end. Last year, 2013, delivered one of the longest and strongest blue-sky stretches the bulls have ever seen, with just the right mix of improving economic conditions, heightened skepticism, and a Federal Reserve not yet putting its foot on the brakes but all of that, again, is wholly in the rear view mirror now.
- To say high corporate profit margins are “expected to persist” is a surprisingly vague bit of hand waving. Without evidence to the contrary, it is a logical thing to expect a trend to keep going but there are a few things we know about the corporate profits boom.
- We know that a powerful driver of the boom was a cycle of cost-cutting, streamlining and fat trimming, taken on with vigor at the point of crisis lows.
- We know that corporate profits post-2009 were enhanced by a series of globally coordinated central bank stimulus efforts on a scale and scope never before seen.
- We know that, for much of the past five years, China acted as a positive driver (as did Asia and other emerging markets).
- We know that, in the United States, wage and inflation pressures (which cut into corporate profits) have been all but non-existent.
- We also know that every single one of those profit-boosting factors – every single last one – is drawing to a close.
-
- The benefits of cost-cutting can only go so far.
-
- The great central bank stimulus experiment, led by the Federal Reserve, is now in twilight with the Fed transitioning to hawkish.
-
- China is now slowing, and is a potential negative for global growth.
-
- Europe is heading back into a potential crisis cycle.
-
- On the United States front, wage and inflation pressures have real potential to make an appearance for the first time in years.
- Why, then, would corporate profits – not just at high levels, but record-breaking nosebleed high levels, in synch with junk bond yields at record-breaking lows – be off-handedly “expected to persist” against such a backdrop?
- It is hard to say anything meaningful about the “young-looking recovery” other than that its composition is very strange. The Federal Reserve itself (and participating global central banks) have conducted one of the biggest and most daring “monetary experiments” in financial history. Thus far it is “so far, so good” but we still really have no idea how things are going to work out in terms of unwinding this whole thing. As such, we don’t know what strange or nasty side effects a Frankenstein-powered economic recovery will exhibit either.
- A six-year-old recovery that still looks young sounds like a freak of nature in normal business cycle terms, which makes it hard to be confident as to what will come next.
- Furthermore, the Fed has openly expressed concern over just exactly how it will extricate itself from certain tricky arrangements relating to a multi-trillion balance sheet and collateral requirements in the bond market.
- To the notion investors are “picking up their courage,” we would say investors have already shown plenty of courage – or perhaps outright stupidity is the word – in choosing to:
- buy fifty year corporates for extra yield that amounts to a handful of basis points,
- scoop up junk bonds at all-time low yields, and
- buy Spanish and Italian debt as if eurozone breakup risk did not exist, even as the Fed whips out the bullhorn to loudly warn rate hikes are coming, possibly soon.
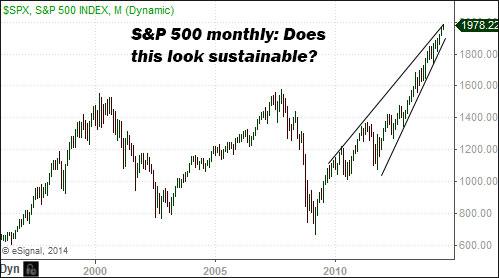
4) Too much valuation nuttiness
Consider the following via Brett Arends and Marketwatch:
“U.S. stocks are now about 80% overvalued on certain key long-term measures, according to research by financial consultant Andrew Smithers, the chairman of Smithers & Co. and one of the few to warn about the bubble of the late 1990s at the time.
The five dates listed at the start of this article (1853, 1906, 1929, 1969, 1999) are the only times since 1802, when data began being tracked, that stocks have been 50% or more overvalued according to these measures. Moreover, only two of those bubbles – 1929 and 1999, both of which were followed by disastrous crashes – were bigger than today.
That’s right: According to Smithers’ data, we are now in the third biggest bubble in U.S. history. (Oh, to jump ahead slightly, he also suspects it will go up even further before it comes back down.)”
Say it again brothers and sisters: You never use valuation to time a market!
click to enlarge
Bearish observers of economic fundamentals have taken this lesson to heart saying “but oh, it could go higher from here” is thus seemingly the proper thing to do in polite company. We are traders, though, and as such we don’t much give a damn for appearing respectable in polite circles. We suss out opportunities to make attractive and limited risk bets when price action and various catalysts tell us that, yes, something meaningful could be happening here, and that is what we see right now – meaningful cracks in the dam in the form of:
-
- small cap and high yield debt divergences,
- the crumbling of the euro,
- sourness of the banks and
- an “end of the road” foreshadowing from the Federal Reserve amid openly hawkish comments
Those lacking a trader’s perspective, and the ability to “pick spots” in which odds are higher than normal for an asymmetric risk ramp-up, will naturally take the valuation-based recusal of (horror of horrors) being one of those “market timers.” (We actually find the “market timing” phrase rather amusing, as the vast majority of those who use it, in the pejorative sense, don’t know even the first thing as to how it’s actually done.)
Via Dshort Advisors, Adam Feik further notes that profits plus a “mystery booster” are driving the market higher:
“In total, earnings have increased by about 53% over the past 48 months (or about an 11% annualized compound rate). In dollars, using data from Standard & Poor’s, earnings have grown from $67.10 per share for the 12-months ending in June 2010, to an estimated $102.49 per share for the most recent 12 months.
Stocks, on the other hand, have increased by over 107% during that same 4-year period (or nearly 18% annualized, including dividend re-investment) so stocks have gone up by 107% when earnings have increased by only 53%…“
Why would stock market appreciation aggressively outpace actual earnings appreciation? There are (at the very least) two basic explanations:
- The stock market is predicting even higher earnings in the quarters and years to come. This viewpoint would place faith and weight in the market’s ability to rationally act (sometimes) as a reliable forward discounting mechanism.
- The Soros-style false trend of the past few years, aided by fundamental factors that made sense at first, has simply gone off the rails, as false trends always do in the end, with investors choosing to extrapolate favorable drivers into infinity – “trees growing to the sky,” if you will – for reasons of emotional bias and institutional lock-in.
It certainly remains possible we go “much higher” from here and yet we can observe it is quite notable that blow-off extrapolations like this always occur at the tail end of a false trend. Whether this is truly “the end” or not, markets are showing identifiable signs of things that happen at or near “the end,” with grounded logical reasons (including here-and-now catalysts, divergences, and other mounting risks to the complacency point of view.)
As Howard Marks so memorably puts it: “Rule No. 1: Most things will prove to be cyclical. Rule No. 2: Some of the greatest opportunities for gain come when people forget Rule No. 1…”
5) Too much “gray swan” risk
The black swan, if you recall, represents surprise risk no one could have anticipated. The gray swan, in contrast, is a reference to crisis risk everyone knew was coming, with only the timing in doubt….[We won’t go into] dissecting the serious escalation of conflict between Russia, Europe and the United States via Ukraine, the Israel/Gaza fallout, and the rapidly increasing risks of a China slowdown….know, however, these risks are real and very much in play.
Editor’s Note: The author’s views and conclusions in the above article are unaltered and no personal comments have been included to maintain the integrity of the original post. Furthermore, the views, conclusions and any recommendations offered in this article are not to be construed as an endorsement of such by the editor.
*http://www.mercenarytrader.com/2014/07/too-much/ (Copyright 2012 Mercenary Trader – All Rights Reserved; From Issue 43 of the Strategic Intelligence Report – If you aren’t getting the SIR each week, you’re missing out. To find out more or subscribe, go here.)
Follow the munKNEE!
- Register for our Newsletter (sample here)
- Find us on Facebook
- Follow us on Twitter (#munknee)
- Subscribe via RSS
Related Articles:
1. Bubble-level Valuations Don’t Cause Bear Markets! These Factors Do
So much analysis we see and hear lately is concerned with whether the stock market is in a bubble or not. The truth of the matter, however, is that bear markets do not begin due to bubble-level valuations being reached and then bursting, but in anticipation of half a dozen mitigating factors as outlined in this article. Read More »
2. What Are the 2 Catalysts That Cause Major Market Corrections Telling Us Today?
There are a number of potential pitfalls out there for the market but, right now, the behavior of the main catalysts for a major correction suggest that there continues to be more right than wrong with the market. Let me explain. Read More »
3. Does Size (Market Cap) Matter?
There continues to be an uncanny relationship between a company’s market capitalization and year-to-date returns. The largest 500 stocks in the Russell 3000 are up an average of 8.5% this year, while the smallest 500 are down an average of -6.1%. What is driving this incredibly strong relationship between market cap and return? Read More »
4. Bigger IS Better! What Does This Selective Advance Mean For the Stock Markets Going Forward?
The average U.S. stock is DOWN over 1% thus far in 2014. How can that be when we’re being told almost daily that the Dow and S&P 500 are hitting new all-time highs? The answer is likely to surprise you. Read More »
5. Size Does Matter: A Look at Market Capitalization and What It Means for Investors
People choose certain stocks for many different reasons – business location; sector strength; product innovation – but some investors choose what to buy based on company size, or market capitalization [believing that size does matter. Yes,] understanding the difference between small-cap, medium-cap and large-cap companies is the first step to making the right choice. [Let me explain.] Words: 600 Read More »


