What investors are actually doing with their money – acting out of fear or greed – is a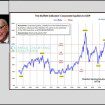 better predictor of future stock market returns than even Buffett’s favorite, and highly touted, total market capitalization-to-GNP valuation measure. How do we use this information as a contrary indicator? How do we put it into practice? Read on.
The above introductory edited (and somewhat paraphrased) excerpts are from an article* by Jesse Felder (thefelderreport.com) entitled How To Beat The Market By Being ‘Fearful When Others Are Greedy’.
Felder goes on to say in further edited excerpts:
Philosophical Economics ran a post back in December titled, “The Single Greatest Predictor Of Future Stock Market Returns,” in which they found that household allocation to equities was correlated to future returns in the stock market by greater than 90%. I ran the same correlation and found that while market cap-to-GDP had an 83% negative correlation to 10-year returns in the stock market, this measure had a 94% negative correlation.
Ultimately, what investors are actually doing with their money – acting out of fear or greed – is a much better predictor of future returns than even the best measure of value.
The Valuation Model
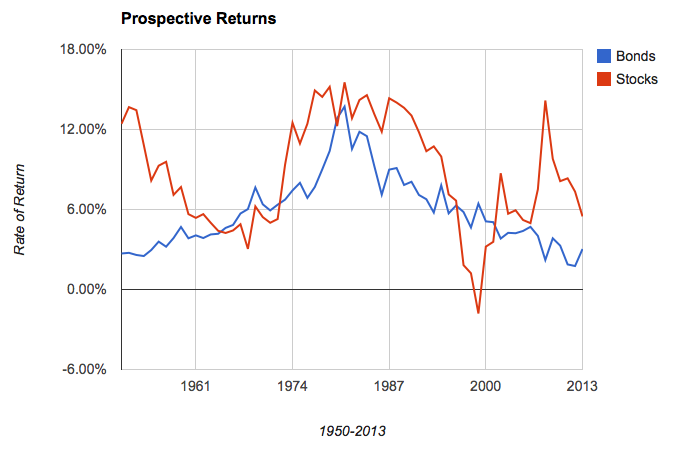
How do we use this information as a contrary indicator? How do we put it into practice? It’s simple: we do just what we did with the fundamental measure. We create a forecasting model that suggests
- what stocks are likely to return over coming decade based upon investors’ allocation to stocks
and then we compare that to
- what the yield was on the 10-year Treasury bond.
Whichever offers the better prospective return should be bought.
A Comparison of the Sentiment Model vs. the Valuation Model
[Below are the results of an analysis I did of] what would have happened if an investor had followed the sentiment model only looking at it once a year at year end starting back in 1950 as compared to the valuation model.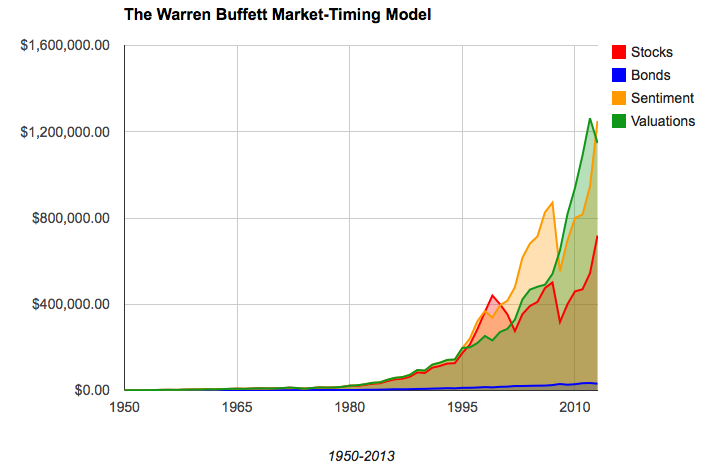
While the sentiment valuation model shown above… didn’t differ much from the valuation model:
- it outperformed during the internet bubble because it kept our hypothetical investor in stocks for two years longer than the valuation model,
- it underperformed during the financial crisis because it didn’t get our investor out of stocks while the valuation model did and
- it kept an investor in stocks at the end of 2012 to capitalize on the huge gains of 2013 while the valuation model did not.
That’s really the main difference between the performance of the two up to this point.
The bottom line is both of these models, due to their exceptional predictive ability, allow an investor to determine not only when, but how, to be fearful and greedy: simply own stocks when they offer the better prospective return, otherwise own bonds.
(Please note that this model is merely for educational purposes. It doesn’t factor in transaction costs or taxes (which could be huge) so it’s not in any way a recommendation for you to use with your investments. That being said, it’s definitely something to consider when evaluating investment opportunities on a broad basis or deciding where to put new money to work.)
Editor’s Note: The author’s views and conclusions in the above article are unaltered and no personal comments have been included to maintain the integrity of the original post. Furthermore, the views, conclusions and any recommendations offered in this article are not to be construed as an endorsement of such by the editor.
*http://thefelderreport.com/2014/08/18/how-to-beat-the-market-by-being-fearful-when-others-are-greedy/
If you liked this article then “Follow the munKNEE” & get each new post via
- Our Newsletter (sample here)
- Twitter (#munknee)
Related Articles:
1. Look Out Below? Buffett Market Indicator Has Now Surpassed 2007 Level
Market Cap to GDP is a long-term valuation indicator that has become popular in recent years, thanks to Warren Buffett and it is now at the second highest level in the past 60 years – even surpassing the levels reached in 2007. Read More »
2. Warren Buffett’s Favorite Valuation Metric Suggests Stock Market Is OVERvalued by 15%
Here’s some perspective on the potential value of the U.S. equity market using Warren Buffett’s favorite valuation metric – total stock market capitalization relative to GDP. Read More »
3. 26 Quotable Quips on Investing by Warren Buffett
“It’s far better to buy a wonderful company at a fair price than a fair company at a wonderful price”, “We simply attempt to be fearful when others are greedy and to be greedy only when others are fearful” and 24 other unforgettable and highly quotable quips on investing by Warren Buffett over the years. Read More »
4. Buffett’s Measure of Stock Market Health, the TMC-to-GNP Ratio, Conveys Concerns
Buffett’s measure – the percentage of total market cap (TMC) relative to the U.S. GNP crossed 100% last week into stretched territory for the first time since 2007 which implies a mere return of around 3.3% annualized (including dividends) over the following years. [This post presents the components of the ratio and the conclusions drawn.] Read More »
5. Sentiment Survey Updates On Stocks, Bonds, Commodities & Currencies
Time for another sentiment update on what the various surveys and committment of traders have to say about the future price expectations for the U.S. stock markets, U.S. Treasury bonds, various currencies and a wide range of commodities including gold and silver. “And the surveys say…!” Read More »


