The Tokyo Nikkei Average rose +82% in just six months in a parabolic move that was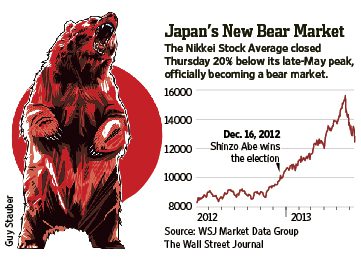 doomed from the start. They almost always are. When a parabolic move breaks, as it did in May, the speed of the decline can be catastrophic and has fallen 22% to date. The downside expectation is for prices to return to the level of the basing pattern that preceded it. In this case between 8300 to 9100. That is not a prediction, just the level we at which we might expect to start looking for a tradable bottom.
So writes Carl Swenlin (www.decisionpoint.com) in edited excerpts from his original article* entitled A Long-Term Look at the Nikkei.
[The following article is presented by Lorimer Wilson, editor of www.FinancialArticleSummariesToday.com and www.munKNEE.com and may have been edited ([ ]), abridged (…) and/or reformatted (some sub-titles and bold/italics emphases) for the sake of clarity and brevity to ensure a fast and easy read. This paragraph must be included in any article re-posting to avoid copyright infringement.]
Swenlin goes on to say in further edited excerpts:
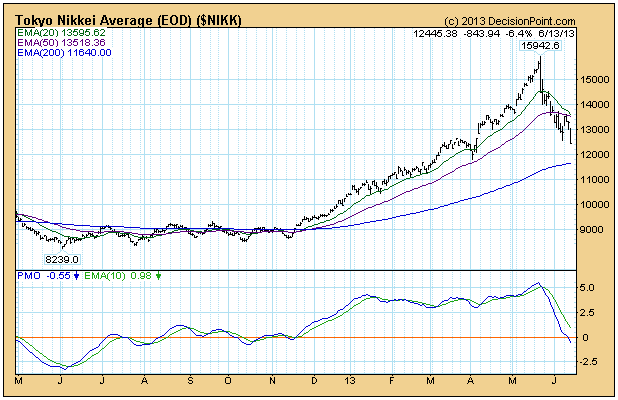
Before we get to the long-term chart, let’s look at the one-year daily bar chart.
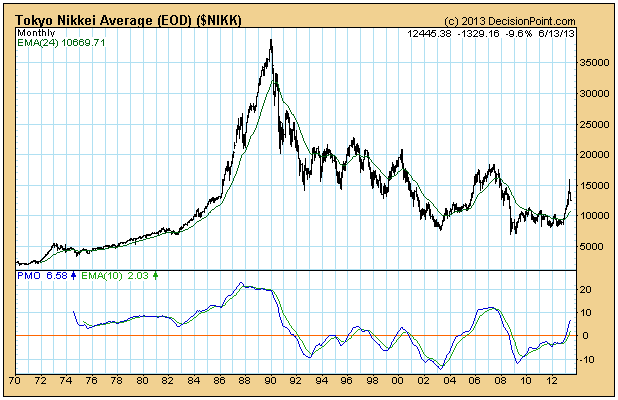
As dramatic as the above chart is, it is hard to beat the long-term chart below for drama, when we look at the parabolic rise from 1970 to the all-time high in 1989. Over the last decade prices seem to have found a base at around 7000, instead of 5000, where the pre-parabolic base was. For this we can thank the super-human efforts of the government to avoid the inevitable by printing money. After over 20 years of avoidance, their economy has still not recovered, and recovery is nowhere in sight.
Conclusion:
Long-term charts put things into perspective, and the recent, exciting six-month rally is shown to be a mere blip in a long, grinding trading range. Also, the possible downside is at least 7000, or maybe 5000.
[Editor’s Note: The author’s views and conclusions in the above article are unaltered and no personal comments have been included to maintain the integrity of the original post. Furthermore, the views, conclusions and any recommendations offered in this article are not to be construed as an endorsement of such by the editor.]
* http://pragcap.com/a-long-term-look-at-the-nikkei (© Copyright 2013 — PRAGMATIC CAPITALISM. All Rights Reserved)
_____
Save time! Here are 4 ways to access the best articles on the internet!
Sign up for our FREE Market Intelligence Report newsletter (sample)
“Follow the munKNEE” daily posts via Twitter or Facebook
Set up an RSS feed: It’s really easy – here’s how
_____
Related Articles:
1. Japan: A Country On the Brink of Fiscal & Economic Disaster!

I wrote several years ago that Japan is a bug in search of a windshield and in January I wrote that 2013 is the Year of the Windshield. Japan is a country that is on the brink of fiscal and economic disaster Read More »
2. Which Country Will Win the Race to Debase Its Currency the Most?
Competitive devaluation [the race to debase] or “Currency War” is more of a process than an event. Nations take turn to debase, back and forth, until the purchasing power of their currencies approaches zero. The map below monitors the progress of debasement as it unfold; country by country, currency by currency. Read More »
3. The Currency War: Which Country Will End Up With the Fastest Currency in the Race to the Bottom?
We believe that we are in the “competitive devaluation” stage presently [see graph below] as country after country is printing money in order to lower rates and doing whatever possible to devalue their currency – to have the fastest currency in the…race to the bottom – in order to export their goods and services. [The next stage will be protectionism and tariffs. This article gives an update on the race to debase.]
I expect the eventual endgame to this whole Keynesian monetary experiment that has been going on ever since World War II [will] finally terminate in a global currency crisis. [That being said,] I’m starting to wonder if we aren’t seeing the first domino – the Japanese yen – start to topple…[It has] cut through not only the 2012 yearly cycle low, but also the 2011 yearly cycle low and never even blinked [and should it continue its steep decline] and break through the 2010 yearly cycle low [of 105.66] I think we have a serious currency crisis on our hands. Needless to say, if the world sees a major currency collapse… it’s going to spark a panic for protection – to gold and silver. Wouldn’t it be fitting that at a time when they are completely loathed by the market they are about to become most cherished? [This article analyzes the situation supported by 3 charts to make for a very interesting read.] Words: 620; Charts: 3
5. U.S. Stock Market is Most OverBought of 30 Countries: Where Does Your Country Rank?

The U.S. is the most overbought country on a list of the 30 largest country ETFs, trading slightly more extended than Japan….6 countries are trading in oversold territory at the moment. [Is your country’s stock market overbought or oversold? Take a look at the table below]. Read More »
6. Stock Market Performances in 21 Countries – Is Your’s Doing Better or Worse?

A lot has been made of strong stock market returns around the world so far this year, but adjusting for currency moves, the returns look a little less flattering. The U.S. dollar is up nearly 4% year to date, while currencies like the Japanese yen, the British pound and the euro are all down. Below is a look at the year-to-date stock market performance of 21 major countries around the world. For each country, we highlight its 2013 performance in local currency vs. U.S. dollar adjusted terms. Read More »
If you don’t think that PM’s are now being manipulated by the Central Banks, then I think that you should not be investing in buying additional PM’s!
BUT
If you believe that the Central Banks cannot continue to keep printing paper money forever then what is happening now is nothing but a huge buying opportunity!
Consider: As the Central Banks further restrict credit and loans to us, what other options besides selling PM’s (at a large discount )do small investors have, if they want to grow what is left of their portfolios? This is a move to drive a stake into the hearts of all those that are still holding PM’s; while at the very same time, these same Central Banks (who are in on the deal) are scooping PM’s up (using their own printed paper money) at very low prices.
My gut feeling is that when the PM “reversal” happens, it will be so extreme that most small investors will not be able to jump on-board before the prices have skyrocketed relative to where they are currently, due to the market dynamics that favor the really big investors.
Here is a great PM question for you, Are the Central Banks still buying Gold, and if so why?
I look forward to your comments!