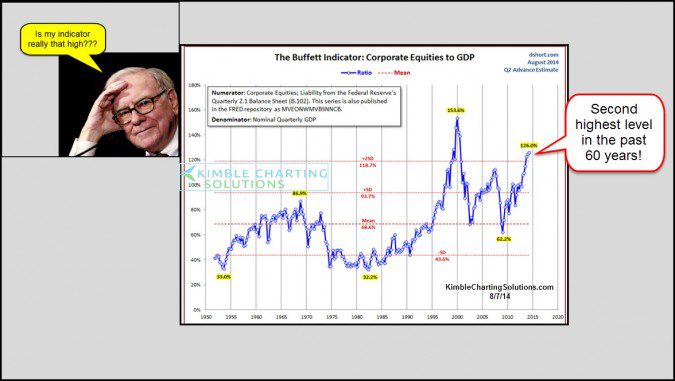
Market Cap to GDP is a long-term valuation indicator that has become popular in recent years, thanks to Warren Buffett and it is now at the second highest level in the past 60 years – even surpassing the levels reached in 2007.
The above introductory comments are edited excerpts from a post* by Chris Kimble (blog.kimblechartingsolutions.com) entitled Buffett Indicator Hitting Second Highest Level in 60 Years!
The following article is presented courtesy of Lorimer Wilson, editor of www.munKNEE.com (Your Key to Making Money!), and www.FinancialArticleSummariesToday.com (A site for sore eyes and inquisitive minds) and has been edited, abridged and/or reformatted (some sub-titles and bold/italics emphases) for the sake of clarity and brevity to ensure a fast and easy read. This paragraph must be included in any article re-posting to avoid copyright infringement.
Kimble goes on to say in further edited excerpts:
The chart below was created by Doug Short and highlights the current level of the Buffett indicator. As you can see its now hitting the second highest levels in the past 60 years, surpassing the levels reached in 2007.
CLICK ON CHART TO ENLARGE
The 5-pack of charts below highlights several important U.S. stock indices that all happen to be facing resistance lines dating back at least 15-years (name of each index in the upper left corner of each chart).
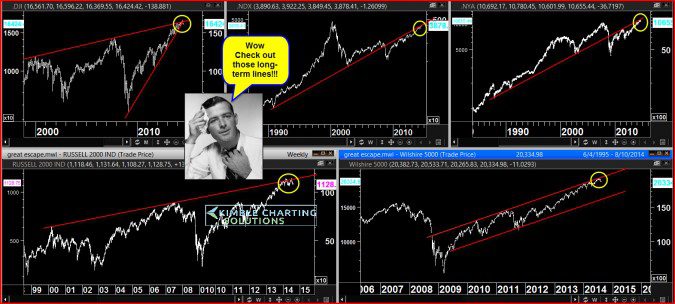
This looks to be a unique and rare “Technamental” situation we have on our hands…I find this set up very interesting!!!
Editor’s Note: The author’s views and conclusions in the above article are unaltered and no personal comments have been included to maintain the integrity of the original post. Furthermore, the views, conclusions and any recommendations offered in this article are not to be construed as an endorsement of such by the editor.
*http://blog.kimblechartingsolutions.com/2014/08/buffett-indicator-hitting-second-highest-level-in-60-years/#sthash.dm8O1Vje.dpuf
Follow the munKNEE!
- Register for our Newsletter (sample here)
- Find us on Facebook
- Follow us on Twitter (#munknee)
Related Articles:
1. World’s Stock Markets Are Saying “Let’s Get Ready to Tumble!”
To ignore all the compelling charts and data below would be irresponsible and, as such, will NOT go unnoticed by institutional investors. Such bearish barometers for stocks worldwide will, unfortunately, be ignored by the ignorant and gullible hoi pollo causing them severe financial loss as investor complacency in the past has nearly always led to a stock market crash. Read More »
2. Financial Asset Values Hang In Mid-air Like Wile E. Coyote – Here’s Why
The financial markets are drastically over-capitalizing earnings and over-valuing all asset classes so, as the Fed and its central bank confederates around the world increasingly run out of excuses for extending the radical monetary experiments of the present era, even the gamblers will come to recognize who is really the Wile E Coyote in the piece. Then they will panic. Read More »
3. Call the “Smart Money’s” Bluff & Stay Invested – Here’s Why
Brace yourself! The stock market is ripe for a nasty selloff according to a number of politicians and even more market pundits – but not so fast. Two very reliable long-term recession indicators strongly suggest that a correction – or worse, the end of the bull market – is highly unlikely given the current state of the economy. Let me explain. Read More »
4. Stock Market Bubble to “POP” and Cause Global Depression
In their infinite wisdom the Fed thinks they have rescued the economy by inflating asset prices and creating a so called “wealth affect”. In reality they have created the conditions for the next Great Depression and now it’s just a matter of time…[until] the forces of regression collapse this parabolic structure. When they do it will drag the global economy into the next depression. Let me explain further. Read More »
5. All Is NOT Hunky Dory In the Stock Market – Here’s Why
We look at this market and we see “too much.” Too much divergence, too much complacency, too much embedded downside risk…the list goes on and covers many things. Let’s make the rounds and see what we find [and what it means for the immediate well-being of the various stock markets.] Read More »
6. Bubble-level Valuations Don’t Cause Bear Markets! These Factors Do
So much analysis we see and hear lately is concerned with whether the stock market is in a bubble or not. The truth of the matter, however, is that bear markets do not begin due to bubble-level valuations being reached and then bursting, but in anticipation of half a dozen mitigating factors as outlined in this article. Read More »
7. What Are the 2 Catalysts That Cause Major Market Corrections Telling Us Today?
There are a number of potential pitfalls out there for the market but, right now, the behavior of the main catalysts for a major correction suggest that there continues to be more right than wrong with the market. Let me explain. Read More »
8. A Stock Market Correction/Crash May Not Occur For Quite A While – Here’s Why
Some investors are sure we’re heading for a crash because we’ve had such an uninterrupted rise in stocks but these things can last much longer than most people realize. While a crash is never out of the realm of possibilities, just because stocks are up doesn’t mean they have to immediately crash. Eventually they will be right. It’s the timing that gets you on these type of calls. Read More »
9. Market Significantly Overvalued. It is Not A Question Of “IF” but “When” It Will Happen!
This is not going to end well, I tell you. The stock market is significantly overvalued at 123%. The question is: “When will it happen?” I think it happens soon. Read More »
10. Stock Market Bull Likely to Continue for Another 2-3 Years – Here’s Why
If you follow the mainstream financial print media, you may have seen that many prominent publications have recently called this stock market a ‘bubble’ and many are waiting for the elusive stock market crash! In our view, however, such bearish ‘bubble’ sentiment is precisely the reason why, in our opinion, the party is likely to continue for at least another 2-3 years. Here’s why & what sectors to take full advantage of. Read More »
11. Bradley Model Suggests Major Turning Point In Stock Market Is Imminent
Back in the 1940s Donald Bradley developed a means to forecast the stock market using the movement of the planets which, according to the noted technical analyst William Eng in his book Technical Analysis of Stocks, Options, and Futures, is the only ‘excellent’ Timing Indicator. Below are current Bradley timing model charts indicating a major turning point in the stock markets is imminent. Read More »
12. Bubbles: Doing NOTHING Is Often the BEST Response – Here’s Why
The benefits of being able to detect a bubble, when you are in its midst, rather than after it bursts, is that you may be able to protect yourself from its consequences. [Below are possible] mechanisms to detect bubbles, how well they work and what to do when you think a particular asset is in one. Read More »
13. Cycle Analysis Suggests S&P 500 Has Topped & Will Decline To Major Low In 2016
While the majority is looking at the Megaphone Pattern correction since the 2000 high and is expecting the market to go back to the lower trend line of this pattern and to make new lows, I think that it will not happen. The opinion of the majority can be used as a contrarian indicator. I think that a healthy correction in this new Secular Bull Market could push the Dow Jones to 12500-13500 (end of 2015 – half 2016) followed by a second leg up of this new Secular Bull Market. Read More »
14. Next Bear Market Shaping Up To Be Quite the Storm – Here’s Why
The U.S. stock market has been closing at one record high after another but, despite the seemingly unending investor optimism more than five years into the current bull market, some worrisome issues are continuing to build under the surface. Like all past bull markets, the latest episode will eventually come to an end and a new bear market will begin and it has the potential to be even worse than the two previous downturns since the start of the new millennium… Read More »
15. Today’s Shiller PE Suggests the Stock Market Is Overvalued By 60%!
We estimate that a ‘fair price’ for the market is a Shiller PE of around 16. With the market at close to a Shiller PE of 26, the market is overvalued by about 60%. Now is not a historically good time to initiate a position in the S&P500. Read More »
16. Fearful In This Market? If Not, You Should Be!
As Warren Buffett is famous for saying “…be fearful when others are greedy and greedy when others are fearful” and now is such a time. The crowd can be right for a long time, but they are rarely right at extremes and, while this time may be different, the probabilities suggest that at the very least it will be a more difficult environment for equities going forward. Read More »
17. Make No Mistake – A Major Stock Sell-off Looms! Here Are 4 Ominous Signs
The 4 fundamentals and technicals discussed in this article accurately called stock market crashes in 2000 and 2007 and these same market metrics are again TODAY warning that a possible financial tsunami is brewing on the horizon. No one knows for certain WHEN the tsunami will hit Wall Street…but, without question, today’s stocks exhibit extremely exaggerated valuations, and extremes never last, so make no mistake, a major stock sell-off looms. Read More »
18. EXPECT & PLAN For A Major Stock Market Correction In the Coming Weeks/Months – Here’s Why & How
The S&P 500 is now up over 180% since troughing in March 2009 and it has been almost 3 years since the stock market experienced a 10% correction. Historically, market corrections happen approximately every 2 years on average. [As such,] we think that this rally is getting very long in the tooth and we wouldn’t be surprised if we have a healthy pullback in the coming weeks or months. Read More »
19. These Indicators Should Scare the Hell Out of Anyone With A Stock Portfolio
…For US stocks — and by implication most other equity markets — the danger signals are piling up to the point where a case can be made that the end is, at last, near. Take a look at these examples of indicators that should scare the hell out of anyone with a big stock portfolio. Read More »
20. This Is One “Crazy, Nastyass” Stock Market! Here’s Why
You can call this current stock market a blowoff or call it a Wile E. Coyote moment or call it a divergence or call it a disconnect or call it a lapse of judgement. You can call it whatever you want but I call it the “Honey Badger” market because this is one “crazy, nastyass” stock market – and I can’t believe I’m watching it happen all over again. Read More »
21. Extreme Greed By the Crowd Suggests You Show Some Fear! Here’s Why
Greed may have been good for Gordon Gekko. but in the investment world it rarely is. As Warren Buffett is famous for saying “…be fearful when others are greedy and greedy when others are fearful” [and now is such a time]…to start showing some level of fear here in the face of extreme greed by the crowd. The crowd can be right for a long time, but they are rarely right at extremes. While this time may be different, the probabilities suggest that at the very least it will be a more difficult environment for equities going forward. Read More »
22. Are We In Phase 3 – the Final Phase – of This Bull Market Yet?
Are we in the third phase of a bull market? Most who will read this article will immediately say “no” but isn’t that what was always believed during the “mania” phase of every previous bull market cycle? With the current bull market now stretching into its sixth year; it seems appropriate to review the three very distinct phases of historical bull market cycles. Read More »
23. Relax! The Stock Market Is Anything But “Scary-Overvalued” – Here’s Why
Are we near the end of one of history’s great stock market rallies? I don’t think so. Yes, prices are in the upper half of their long-term trends, but it’s not what you might call “scary-overvalued.” There is still plenty of room on the upside before historical precedents are violated. Let me explain further. Read More »
24. Collapse of S&P 500 May Be Only Weeks Ahead! Here’s Why
When Staple sector (i.e. defensive) stocks started to reflect greater relative strength than Discretionary sector stocks back in 2000 and again in 2007, the S&P 500 began to fall dramatically in the ensuing months. That’s happening again. Can a collapse of the S&P 500 be far behind? Read More »
25. A 20%+ Sell-off is Brewing In the Lofty U.S. Stock Markets – Here’s Why & What the Future Holds
For today’s seriously overextended and overvalued US stock markets the best-case scenario is a full-blown correction approaching 20% emerging soon while the worst case is a new cyclical bear market that ultimately leads to catastrophic 50% losses. Read More »


