If the past long-term cyclical correlations between interest rates, equities, and 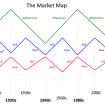 commodities were to play out as they have done going back to the 1880s, U.S. stocks and interest rates should continue to rise as commodities either fall or underperform according to a 60-year cyclical pattern model referred to as The Market Map.
The above introductory comments are edited excerpts from an article* by Cris Sheridan (FinancialSense.com) entitled Is A Long-Term Secular Bull Market In Stocks Possible?.
The following article is presented courtesy of Lorimer Wilson, editor of www.munKNEE.com (Your Key to Making Money!), and www.FinancialArticleSummariesToday.com (A site for sore eyes and inquisitive minds) and has been edited, abridged and/or reformatted (some sub-titles and bold/italics emphases) for the sake of clarity and brevity to ensure a fast and easy read. This paragraph must be included in any article re-posting to avoid copyright infringement.
Sheridan goes on to say in further edited excerpts:
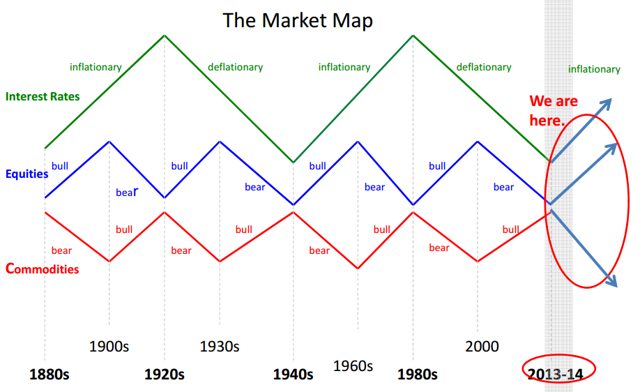
Below is a simplified view of the cyclical pattern identified by Dan Wantrobski from Janney Capital Markets, which he calls “The Market Map” (click image to enlarge):
 Source: Janney Capital Markets
Although the chart above represents approximate long-term correlations between stocks, commodities, and interest rates (bonds), and not exact turning points, it is interesting from a “big picture” point of view…Combining all three into the above diagram is rather unique and probably new to most as a way to help identify longer-term shifts in the market and between asset classes.
With interest rates and stocks having already put in what appear to be long-term bottoms and commodities also trending downwards from their prior record highs, this long-term cyclical framework suggests that we are somewhere in the “We are here” portion of the chart, coinciding with a transition from a deflationary bear market that started in 2000 to a new secular inflationary bull market cycle.
According to Wantrobski the three main drivers of these long-term cyclical shifts are:
- valuation,
- demographics, and
- credit.
Of the three, valuation is probably the most controversial given current prices. Of the 130+ years shown in Janney’s long-cycle model, the only time where the market experienced a similar inflection point was during the 1940s, which preceded a multi-decade bull market in stocks well into the ’60s.
Should we expect the same type of run in stocks from current stretched levels? This seems highly doubtful, especially given that stocks were near all-time valuation lows during the ’40s as opposed to today where they stand near the highs.
Given the difficulties in reconciling this as the beginning stages of a long-term secular bull market with current overstretched valuations, there are a couple obvious ways this could play out.
- Stocks could correct at some point in the near future, which would bring valuations closer to long-term historical averages.
- Another perhaps unthinkable possibility is that stocks continue to climb higher in the secular bull market scenario to close the gap or eventually overtake the prior valuation highs set during the 2000 tech bubble.
Although the first scenario seems more likely, given the historically unprecedented scale of intervention and active participation by central banks in the stock market today, it does not seem unreasonable to question whether prior valuation records might be broken.
If we have indeed passed that inflection point…[then] we should see stocks continue to outperform both bonds and commodities over a longer-than-expected timeframe.
Editor’s Note: The author’s views and conclusions in the above article are unaltered and no personal comments have been included to maintain the integrity of the original post. Furthermore, the views, conclusions and any recommendations offered in this article are not to be construed as an endorsement of such by the editor.
*http://seekingalpha.com/article/2413235-is-a-long-term-secular-bull-market-in-stocks-possible?ifp=0
Follow the munKNEE!
- Register for our Newsletter (sample here)
- Find us on Facebook
- Follow us on Twitter (#munknee)
Related Articles:
1. Market Returns to Be Dismal Over Next 10 Years! Here’s Why
If you have 401k assets, are a financial professional or individual investors looking to construct portfolios and not move monies very often, and looking to beat inflation over an extended period of time, the chart below is well worth being aware of. Read More »
2. Yes, You Can Time the Market – Use These Trend Indicators
Remember, the trend is your friend and now you have an arsenal of such indicators to make an extensive and in-depth assessment of whether you should be buying or selling. If ever there was a “cut and save” investment advisory this article is it. Words: 1579 Read More
3. Stocks Will UNDERPERFORM Bonds Over Next 10 Year Period!
The stock market is likely to experience a 4-year overall market loss of -25%, followed by positive 9% average annual total returns for the S&P 500 over the subsequent 6-year period, which would compound to produce a 10-year total return averaging 2.3%. Read More »
4. Buckle Up: Gold’s About to Begin A Major Breakout! Here’s Why
Buckle up! Gold is coming out of hibernation within the next 6 to 12 months and will then begin a major breakout to the upside to at least $3,600 over the next 2 to 4 years. Read More »
5. The Case For $5,000 Silver – Yes, $5,000 Silver
If the price of silver were based directly on the real physical silver market, silver’s price should be at $5,000 an ounce. I’m not saying the price of silver will reach $5,000 an ounce; I’m just saying that the actual PHYSICAL silver spot price is not only extremely undervalued, but that it is an illusion compared to the real value of an ounce of physical silver, since it is totally disconnected from reality. [Let me explain further.] Read More »
6. Goldbugs Should Pray for Higher Interest Rates – Here’s Why
Interest rates cannot stay low forever so, while the Fed’s low interest rate policy is pushing stock and bond prices higher, it is also infusing potential energy into the gold market. Therefore, it is only a matter of “When?” and not “If?” this trend reverses and gold catapults higher. Read More »
7. Gold Shares Have Bottomed & Will Now Outperform Physical Gold Over Next 5.5 Years
2014 could end up being the turnaround year for precious metals and a bull market ascent could develop in 2015 – especially so in gold shares. Here’s why. Read More »
8. A 5-digit Price for Gold Is Not That Far-fetched – Here’s Why
When I suggest that the gold price can rise to a level in the 5-digit range, I expect to be ridiculed or to have my forecast overlooked by most market participants. Nevertheless, as we will see in a moment the prospect of 5-digit gold is not so far-fetched. Read More »
9. Plenty of Additional Upside Potential Directly Ahead for PM Miners
Precious metals shares are breaking out again after a brief consolidation. It’s time to channel your inner Old Turkey, realize this is a bull market and act accordingly. Read More »
10. These 6 Indicators Reveal A Great Deal About Market’s “Upside” Potential
Trying to predict markets more than a couple of days into the future is nothing more than a “wild ass guess” at best but, that being said, we can make some reasonable assumptions about potential outcomes based on our extensive analysis of these 6 specific price trend and momentum indicators. Read More »
11. Look Out Below? Buffett Market Indicator Has Now Surpassed 2007 Level
Market Cap to GDP is a long-term valuation indicator that has become popular in recent years, thanks to Warren Buffett and it is now at the second highest level in the past 60 years – even surpassing the levels reached in 2007. Read More »
12. This Stock Market Decline: The “Real Deal” Or Just Another “Head-fake” Bear Trap?
Is this stock market decline the “real deal” (that is, the start of a serious correction of 10% or more) or is it just another garden-variety dip in the long-running Bull market? Read More »
13. What Does the 10-year Yield’s Death Cross Mean For Stocks?
The 10-year yield’s Death Cross has proven to be a pretty significant risk-off shot across the bow over the last decade and this matters today because the 10-year yield put in a Death Cross back in early April of this year. So what does the 10-Year’s Death Cross mean for stocks this time? Read More »
14. Financial Asset Values Hang In Mid-air Like Wile E. Coyote – Here’s Why
The financial markets are drastically over-capitalizing earnings and over-valuing all asset classes so, as the Fed and its central bank confederates around the world increasingly run out of excuses for extending the radical monetary experiments of the present era, even the gamblers will come to recognize who is really the Wile E Coyote in the piece. Then they will panic. Read More »
15. World’s Stock Markets Are Saying “Let’s Get Ready to Tumble!”
To ignore all the compelling charts and data below would be irresponsible and, as such, will NOT go unnoticed by institutional investors. Such bearish barometers for stocks worldwide will, unfortunately, be ignored by the ignorant and gullible hoi pollo causing them severe financial loss as investor complacency in the past has nearly always led to a stock market crash. Read More »
16. Stock Market Bubble to “POP” and Cause Global Depression
In their infinite wisdom the Fed thinks they have rescued the economy by inflating asset prices and creating a so called “wealth affect”. In reality they have created the conditions for the next Great Depression and now it’s just a matter of time…[until] the forces of regression collapse this parabolic structure. When they do it will drag the global economy into the next depression. Let me explain further. Read More »
17. Call the “Smart Money’s” Bluff & Stay Invested – Here’s Why
Brace yourself! The stock market is ripe for a nasty selloff according to a number of politicians and even more market pundits – but not so fast. Two very reliable long-term recession indicators strongly suggest that a correction – or worse, the end of the bull market – is highly unlikely given the current state of the economy. Let me explain. Read More »
18. All Is NOT Hunky Dory In the Stock Market – Here’s Why
We look at this market and we see “too much.” Too much divergence, too much complacency, too much embedded downside risk…the list goes on and covers many things. Let’s make the rounds and see what we find [and what it means for the immediate well-being of the various stock markets.] Read More »
19. Mixed Signals About Direction of Stock Market Abound – Here Are 10
[No wonder you are confused!] Several technical and fundamental indicators have flashed caution to no avail and this has given way to an uncomfortable tension beneath the surface as investors try to find answers while keeping pace with performance. Below are 10 mixed signals about the near-term direction and theme of the markets. Read More »20. What Are the 2 Catalysts That Cause Major Market Corrections Telling Us Today?
There are a number of potential pitfalls out there for the market but, right now, the behavior of the main catalysts for a major correction suggest that there continues to be more right than wrong with the market. Let me explain. Read More »
21. A Stock Market Correction/Crash May Not Occur For Quite A While – Here’s Why
Some investors are sure we’re heading for a crash because we’ve had such an uninterrupted rise in stocks but these things can last much longer than most people realize. While a crash is never out of the realm of possibilities, just because stocks are up doesn’t mean they have to immediately crash. Eventually they will be right. It’s the timing that gets you on these type of calls. Read More »
22. Market Significantly Overvalued. It is Not A Question Of “IF” but “When” It Will Happen!
This is not going to end well, I tell you. The stock market is significantly overvalued at 123%. The question is: “When will it happen?” I think it happens soon. Read More »
23. Stock Market Bull Likely to Continue for Another 2-3 Years – Here’s Why
If you follow the mainstream financial print media, you may have seen that many prominent publications have recently called this stock market a ‘bubble’ and many are waiting for the elusive stock market crash! In our view, however, such bearish ‘bubble’ sentiment is precisely the reason why, in our opinion, the party is likely to continue for at least another 2-3 years. Here’s why & what sectors to take full advantage of. Read More »
24. Bradley Model Suggests Major Turning Point In Stock Market Is Imminent
Back in the 1940s Donald Bradley developed a means to forecast the stock market using the movement of the planets which, according to the noted technical analyst William Eng in his book Technical Analysis of Stocks, Options, and Futures, is the only ‘excellent’ Timing Indicator. Below are current Bradley timing model charts indicating a major turning point in the stock markets is imminent. Read More »
25. Cycle Analysis Suggests S&P 500 Has Topped & Will Decline To Major Low In 2016
While the majority is looking at the Megaphone Pattern correction since the 2000 high and is expecting the market to go back to the lower trend line of this pattern and to make new lows, I think that it will not happen. The opinion of the majority can be used as a contrarian indicator. I think that a healthy correction in this new Secular Bull Market could push the Dow Jones to 12500-13500 (end of 2015 – half 2016) followed by a second leg up of this new Secular Bull Market. Read More »
26. Next Bear Market Shaping Up To Be Quite the Storm – Here’s Why
The U.S. stock market has been closing at one record high after another but, despite the seemingly unending investor optimism more than five years into the current bull market, some worrisome issues are continuing to build under the surface. Like all past bull markets, the latest episode will eventually come to an end and a new bear market will begin and it has the potential to be even worse than the two previous downturns since the start of the new millennium… Read More »
27. Fearful In This Market? If Not, You Should Be!
As Warren Buffett is famous for saying “…be fearful when others are greedy and greedy when others are fearful” and now is such a time. The crowd can be right for a long time, but they are rarely right at extremes and, while this time may be different, the probabilities suggest that at the very least it will be a more difficult environment for equities going forward. Read More »
28. Make No Mistake – A Major Stock Sell-off Looms! Here Are 4 Ominous Signs
The 4 fundamentals and technicals discussed in this article accurately called stock market crashes in 2000 and 2007 and these same market metrics are again TODAY warning that a possible financial tsunami is brewing on the horizon. No one knows for certain WHEN the tsunami will hit Wall Street…but, without question, today’s stocks exhibit extremely exaggerated valuations, and extremes never last, so make no mistake, a major stock sell-off looms. Read More »
29. EXPECT & PLAN For A Major Stock Market Correction In the Coming Weeks/Months – Here’s Why & How
The S&P 500 is now up over 180% since troughing in March 2009 and it has been almost 3 years since the stock market experienced a 10% correction. Historically, market corrections happen approximately every 2 years on average. [As such,] we think that this rally is getting very long in the tooth and we wouldn’t be surprised if we have a healthy pullback in the coming weeks or months. Read More »
30. These Indicators Should Scare the Hell Out of Anyone With A Stock Portfolio
For US stocks — and by implication most other equity markets — the danger signals are piling up to the point where a case can be made that the end is, at last, near. Take a look at these examples of indicators that should scare the hell out of anyone with a big stock portfolio. Read More »
31. This Is One “Crazy, Nastyass” Stock Market! Here’s Why
You can call this current stock market a blowoff or call it a Wile E. Coyote moment or call it a divergence or call it a disconnect or call it a lapse of judgement. You can call it whatever you want but I call it the “Honey Badger” market because this is one “crazy, nastyass” stock market – and I can’t believe I’m watching it happen all over again. Read More »
32. Extreme Greed By the Crowd Suggests You Show Some Fear! Here’s Why
Greed may have been good for Gordon Gekko. but in the investment world it rarely is. As Warren Buffett is famous for saying “…be fearful when others are greedy and greedy when others are fearful” [and now is such a time]…to start showing some level of fear here in the face of extreme greed by the crowd. The crowd can be right for a long time, but they are rarely right at extremes. While this time may be different, the probabilities suggest that at the very least it will be a more difficult environment for equities going forward. Read More »
33. Are We In Phase 3 – the Final Phase – of This Bull Market Yet?
Are we in the third phase of a bull market? Most who will read this article will immediately say “no” but isn’t that what was always believed during the “mania” phase of every previous bull market cycle? With the current bull market now stretching into its sixth year; it seems appropriate to review the three very distinct phases of historical bull market cycles. Read More »
34. Relax! The Stock Market Is Anything But “Scary-Overvalued” – Here’s Why
Are we near the end of one of history’s great stock market rallies? I don’t think so. Yes, prices are in the upper half of their long-term trends, but it’s not what you might call “scary-overvalued.” There is still plenty of room on the upside before historical precedents are violated. Let me explain further. Read More »
35. Is Now the Calm Before the Storm?
I’d argue that the record low volume shows investors aren’t looking ahead as much as looking behind and reminiscing at how good things have been over the past five years or so. They’re expecting more of the same even though it’s mathematically impossible people. Read More »
36. There’s Evidence – Plenty of It – That the Bear Is No Longer Hibernating. Here’s Why
The health of a market is best assessed along three vectors: fundamentals, technicals (price action) and sentiment and this is what each is saying about the health of the markets these days. Read More »
37. A 20%+ Sell-off is Brewing In the Lofty U.S. Stock Markets – Here’s Why & What the Future Holds
For today’s seriously overextended and overvalued US stock markets the best-case scenario is a full-blown correction approaching 20% emerging soon while the worst case is a new cyclical bear market that ultimately leads to catastrophic 50% losses. Read More »
38. 2 Stock Market Indicators Are Saying “Be careful, don’t get caught up in the euphoria”
In the midst of all the optimism we see towards key stock indices these days, there are two leading indicators that are flashing warning signals. They say, “Be careful, and don’t get caught up in the euphoria.” Read More »
39. Beginnings of Massive Stock Market Correction Developing: Don’t Delay, Prepare Today!
No stock can resist gravity forever. What goes up must eventually come down. This is especially true for stock prices that become grotesquely distorted. We have been – and still are – living in another dotcom bubble, and – like the last one – it is inevitable that it is going to burst. Read More »
40. Is This Just a Dip Within an Ongoing Uptrend OR Have the Bears Finally Awakened?
Is the current stock market correction simply just a dip within an ongoing uptrend OR have the “bears” finally awakened from their winter hibernation? [Below are my views on the subject plus those of several others to help you arrive at an informed conclusion]. Read More »
41. 3 Historically Proven Market Indicators Warn of an Impending Market Top
It’s frustrating to see key stock indices keep pushing higher when historically proven market indicators are all warning of a crash ahead. Irrationality is exuberant to say the very least, and that’s why I believe this rally is counting its last days. Read More »
42. Time the Market With These Market Strength & Volatility Indicators
There are many indicators available that provide information on stock and index movement to help you time the market and make money. Market strength and volatility are two such categories of indicators and a description of six of them are described in this “cut and save” article. Read on! Words: 974 Read More »
43. The Stock Market Is a Risky Place to Be – Here’s Why
With both the fundamentals and the technicals saying the stock market is a risky place to be, we await its crash back to reality. Here’s why. Read More »
44. Bubble-level Valuations Don’t Cause Bear Markets! These Factors Do
So much analysis we see and hear lately is concerned with whether the stock market is in a bubble or not. The truth of the matter, however, is that bear markets do not begin due to bubble-level valuations being reached and then bursting, but in anticipation of half a dozen mitigating factors as outlined in this article. Read More »
45. Ride the Market Waves With These 6 Momentum Indicators
It is hard to know what to buy or sell let alone just when to prudently do so. Thank goodness there are indicators available that provide information of stock and index movement of a more immediate nature to help you make such important decisions. This article describes the 6 most popular Momentum Indicators. If ever there was a “cut and save” investment advisory this is it! Words: 1234 Read More »
46. Its Time to Stop Trying to Time the Market & Start Playing the Percentages – Here’s Why
Remember the game Musical Chairs? It seems that investors on Wall Street have been playing this game recently, as more and more we are seeing signs that the current bull market may be reaching its final stages. Each new sign that appears represents just one more chair being taken away from the game. The question investors need to ask is “where will I be when the music stops”? Read More »
47. Bubbles: Doing NOTHING Is Often the BEST Response – Here’s Why
The benefits of being able to detect a bubble, when you are in its midst, rather than after it bursts, is that you may be able to protect yourself from its consequences. [Below are possible] mechanisms to detect bubbles, how well they work and what to do when you think a particular asset is in one. Read More »
48. The Best Stock Market Indicator – Ever
Below is a description of what I believe to be the best stock market indicator – ever. I am referring to the percentage of S&P 100 stocks above their 200 DMA which gives traders a clear early warning signal of impending serious market downturns and later safe re-entry points. Read More »
49. Don’t Try to Time the Market; Dollar-Cost Average Instead. Here’s Why
Everyone is worrying that we are at or near a market peak and this has investors extremely hesitant to buy stocks for fear of a big decline or perhaps even a crash. Obsessing over the risk of a crash, however, could lead to analysis paralysis but there is a basic investing strategy that can save investors from losing too much hair as they make the decision to buy stocks. It’s called dollar-cost averaging. Let me explain how it works and why it’s great for investors with long-term investing horizons. Read More »
50. Is Using the VIX to “buy the freaking dips” a Good Strategy?
Since the U.S. stock market still appears to be trying to make up its mind which way things will go from here, this appears to be as good a time as any to expand on the idea of using the VIX to “buy the freaking dips.” Read More »
51. Stock Market Crash Coming? Here’s How to Protect Yourself
Following the 2007-09 financial crisis, many investors decided they needed insurance on their portfolio to protect against the possibility of another “black swan” event and poured money into a host of new funds that were supposed to help if there was another downturn — long/short funds, tail risk strategies, absolute return funds, option hedging strategies, tactical asset allocation funds and the like – but they missed the idea completely. They were trying to plan ahead for uncertain events that could surprise everyone. Of course this is impossible, because you can’t hedge out the risks of unknown events – they’re unknown after all. So how should an investor protect oneself from another such occurrence? The answer is below. Read More »
52. There IS Danger Ahead for the Markets – Really! Here’s Why
We fail to pay attention to the warnings signs as long as we see no immediate danger and keep our foot pressed to the accelerator believing that since it hasn’t happened yet, it won’t. This time is only “different” from the perspective of the “why” and “when” the next major event occurs. Below are analyses and exhibits to support that contention. Read More »
53. Soros’ $Billion Bearish Bet on U.S. Stocks Will Fail – Here’s Why
It’s a boom time for doomsayers according to the cover of Barron’s and such paranoia-inducing prognostications are only going to get bolder, and more frequent, thanks to the fact that billionaire George Soros’ hedge fund firm has increased its bearish bet on stocks – a put position on the S&P 500 Index – by a staggering 154% in the most recent quarter…accounting for 11.13% of his holdings…implying that the stock market is headed for a nasty fall. The efforts of the doom-and-gloom crowd to try and scare you stockless aren’t going to succeed this time, though, and here’s why. Read More »
54. Yes, You Can Time the Market – Use These Trend Indicators
Remember, the trend is your friend and now you have an arsenal of such indicators to make an extensive and in-depth assessment of whether you should be buying or selling. If ever there was a “cut and save” investment advisory this article is it. Words: 1579 Read More »
55. End of “Wall Street Party” Will Be a Catastrophe! Here’s Why
The markets are considerably, fantastically overbought and that whatever happens after this “Wall Street Party” is going to be a sort of catastrophe. Here’s why. Read More »
56. “The Small Dogs of the Dow” Strategy Is a Real Winner! Here’s What It Is & How It Works
The Small Dogs of the Dow is a simple and effective strategy that has outperformed the Dow and the S&P 500 significantly over the last 20 years. Let me present this in simple terms: Read More »
57. Stock Market Bubble Going to Burst & Unleash Destructive Forces on Global Economy
The Fed has manufactured a parabolic move in the stock market…which is much more aggressive (and thus even more unsustainable) than witnessed at either the 2000 or 2007 stock market tops. Parabolas always collapse – there are never any exceptions – so when the pin finds this bubble it’s going to take down not only our stock market, but unleash a destructive force on the global economy. Read More »
58. These Indicators Suggest Stock Market Returns Are “Too Good To Be True”
Current macro conditions indicate that we are in a sweet spot for equity returns…that global growth is continuing and there is little or no tail risk in the immediate future. It’s time to get long equities…but I have this nagging feeling that these market conditions are too good to be true. If you look, there are a number of technical and fundamental clouds on the horizon. Read More »
59. Don’t Be Scared “Stockless”! There’s No Fear Anymore – Anywhere!
There’s no fear anymore – anywhere – and I’m talking about the type of fear that overwhelms investors – and, in turn, the market. The surest indication of this can be found in the following chart. Read More »


