The U.S. stock market has been closing at one record high after another but, despite the seemingly unending investor optimism more than five years into the current bull market, some worrisome issues are continuing to build under the surface. Like all past bull markets, the latest episode will eventually come to an end and a new bear market will begin and it has the potential to be even worse than the two previous downturns since the start of the new millennium…
The above are edited excerpts from an article* by Eric Parnell, CFA (gerringcapital.com) as originally posted on SeekingAlpha.com under the title The Worst Bear Market Is Yet To Come.
The following article is presented by Lorimer Wilson, editor of www.munKNEE.com (Your Key to Making Money!) and the FREE Market Intelligence Report newsletter (sample here) and has been edited, abridged and/or reformatted (some sub-titles and bold/italics emphases) for the sake of clarity and brevity to ensure a fast and easy read. This paragraph must be included in any article re-posting to avoid copyright infringement.
Parnell goes on to say in further edited excerpts:
Several different points support the potential for this outcome.
1. Valuation
When breaking apart the data, stocks are actually just as expensive, if not more so generally, than they were at the market peaks in both 2000 and 2007. At first glance, this statement seems absolutely preposterous…After all, the bull market that ended in 2000 was marked by some of the most absurd valuation readings in market history including a P/E ratio based on trailing 12-month as reported earnings running north of 30 times at the market peak, which of course is considerably higher than today’s reading at just over 19 times.
How could it possibly be the case that stocks are generally more expensive today?…
- [Because] the aggregate valuation readings on the S&P 500 Index at its 2000 peak, [while] very high…[were] heavily concentrated in one single market sector – technology – and the valuations from that…sector, made up a mind boggling 35% of total U.S. market cap in March 2000 (for context, it constitutes just 19% today), were extreme in their frothiness.
- [Indeed,] when breaking apart the data, and setting aside the technology sector and those industries closely related to it, multiples across much of the rest of the market were actually fairly reasonable. In fact, a fair number of stocks were even trading at meaningfully lower valuations in 2000 versus what we are seeing today.
Valuation Comparison of DJIA Constituents At Market Peak In 2000, As Of Today & the % Change
To highlight this point in more detail, the valuations of the constituent members of the Dow Jones Industrial Average both at the market peak in 2000 and today are compared below. It should be noted that the list includes those companies that were members either in 2000 or today and excludes companies that either do not have consistent data for comparison or experienced a major transformational change along the way (i.e. Eastman Kodak (KODK) and General Motors (GM) entering bankruptcy, etc.). The companies are also grouped by the 9 major GICS sectors.
1. Energy
- Chevron (CVX): 10.6 vs 11.9, +12.3%
- Exxon Mobil (XOM): 17.3 vs 13.6, -21.4%
2. Materials
- DuPont (DD): 18.0 vs 22.1, +22.8%
- Alcoa (AA): 17.6 vs 39.5, +124.4%
- International Paper (IP): 17.1 vs 21.5, +25.7%
3. Industrials
- 3M Company (MMM): 19.9 vs 20.6, +3.5%
- Boeing (BA): 17.1 vs 23.3, +36.3%
- Caterpillar (CAT): 12.8 vs 17.8, +39.1%
- General Electric (GE): 40.1 vs 21.9, -45.4%
- United Technologies (UTX): 17.4 vs 18.9, +8.6%
- Honeywell (HON): 16.2 vs 18.8, +16.0%
4. Consumer Discretionary
- Walt Disney (DIS): 39.5 vs 23.0, -41.8%
- Home Depot (HD): 46.6 vs 20.6, -55.8%
- McDonald’s (MCD): 22.9 vs 18.6, -18.8%
- Nike (NKE): 22.7 vs 25.6, +12.8%
5. Consumer Staples
- Coca-Cola (KO): 37.5 vs 21.8, -41.9%
- Procter & Gamble (PG): 29.7 vs 21.3, -28.3%
- Wal-Mart (WMT): 38.0 vs 16.0, -57.9%
- Altria (MO): 7.4 vs 19.1, +158.1%
6. Health Care
- Johnson & Johnson (JNJ): 26.4 vs 19.6, -25.8%
- Merck (MRK): 25.6 vs 38.2, +49.2%
- Pfizer (PFE): 40.7 vs 18.0, -55.8%
- United Healthcare (UNH): 19.6 vs 14.7, -25.0%
7. Financials
- Goldman Sachs (GS): 15.1 vs 10.5, -30.5%
- JP Morgan Chase (JPM): 17.2 vs 13.8, -19.8%
- Travelers (TRV): 9.0 vs 9.1, +1.1%
8. Information Technology
- Cisco (CSCO): 99.7 vs 16.6, -83.4%
- Intel (INTC): 36.1 vs 14.7, -59.3%
- IBM (IBM): 24.8 vs 12.3, -50.4%
- Microsoft (MSFT): 137.4 vs 15.1, -89.0%
- Hewlett-Packard (HPQ): 33.3 vs 11.9, -64.3%
9. Telecom Services
- AT&T (T): 20.3 vs 10.2, -49.8%
- Verizon (VZ): 18.1 vs 11.0, -39.2%
When reviewing the above list of valuation comparisons, a few key points stand out.
- The valuations from the cyclical core of the U.S. economy in the energy, materials and industrials sectors are higher today, in some cases considerably, than they were in 2000.
- A large percentage of the companies that are meaningfully less expensive today than they were in 2000 were at the center of the technology, media and telecom (TMT) craze that engulfed the market in froth at the turn of the millennium. This list includes Disney, Cisco, Intel, IBM, Microsoft, Hewlett-Packard, AT&T and Verizon as well as General Electric to a certain extent as well.
- Those that remain are a fairly evenly split group.
As a result, one could reasonably conclude that when extracting the extreme high fliers from the picture, stock multiples on an individual level are just as high if not more so today than they were in 2000 in a number of cases.
Valuation Comparison of DJIA Constituents At Market Peak In 2007, As Of Today & the % Change
Of course, even if one stands by the notion that valuations are still reasonable today and should help protect against a severe market pullback, the evidence when comparing the multiples in today’s market to that of 2007 quickly dispels this idea.
1. Energy
- Chevron: 9.4 vs 11.9, +26.6%
- Exxon Mobil: 11.4 vs 13.6, +19.3%
2. Materials
- DuPont: 15.0 vs 22.1, +47.3%
- Alcoa: 12.4 vs 39.5, +218.5%
- International Paper: 16.2 vs 21.5, +25.7%
3. Industrials
- 3M Company: 15.0 vs 20.6, +37.3%
- Boeing: 17.9 vs 23.3, +30.2%
- Caterpillar: 13.7 vs 17.8, +29.9%
- General Electric: 17.2 vs 21.9, +27.3%
- United Technologies: 16.8 vs 18.9, +12.5%
- Honeywell: 17.3 vs 18.8, +8.7%
4. Consumer Discretionary
- Walt Disney: 17.8 vs 23.0, +29.2%
- Home Depot: 15.4 vs 20.6, +33.8%
- McDonald’s: 17.6 vs 18.6, +5.7%
- Nike: 16.4 vs 25.6, +56.1%
5. Consumer Staples
- Coca-Cola: 21.0 vs 21.8, +3.8%
- Procter & Gamble: 20.5 vs 21.3, +3.9%
- Wal-Mart: 14.9 vs 16.0. +7.4%
- Altria: 16.3 vs 19.1, +17.2%
6. Health Care
- Johnson & Johnson: 15.4 vs 19.6, +27.3%
- Merck: 34.1 vs 38.2, +12.0%
- Pfizer: 11.5 vs 18.0, +56.5%
- United Healthcare: 15.3 vs 14.7, -3.9%
7. Financials
- Goldman Sachs: 8.5 vs 10.5, +23.5%
- JP Morgan Chase: 10.9 vs 13.8, +26.6%
- Travelers: 7.8 vs 9.1, +16.7%
8. Information Technology
- Cisco: 22.0 vs 16.6, -24.5%
- Intel: 19.9 vs 14.7, -26.1%
- IBM: 14.8 vs 12.3, -16.9%
- Microsoft: 19.9 vs 15.1, -24.1%
- Hewlett-Packard: 16.5 vs 11.9, -27.9%
9. Telecom Services
- AT&T: 14.2 vs 10.2, -28.2%
- Verizon: 17.6 vs 11.0, -37.5%
In comparison to 2007, today’s stock valuations are meaningfully higher almost across the board. The only exception comes once again from the TMT space, as many of these companies were still in the process of unwinding the excesses from the technology bubble even toward the end of last decade. What this demonstrates is that stocks can be trading at multiples that are considerably less than today’s levels and still plunge into a major decline in losing more than half of their value as they did during the second bear market since the turn of the millennium.
…[Do] historically low interest rates justify today’s high valuations? Perhaps, but this is not a factor that can sustain historically high valuations indefinitely into the future. After all, the Fed’s zero interest rate policy is not a permanent condition. At some point, interest rates are likely to rise either by the Fed’s choice or by the market’s force – and these valuations will need to adjust accordingly when that time comes.
Taking this a step further, what of the quality of today’s earnings?
- Many companies are continuing to operate at or near historically high profit margins and have supported higher earnings per share, or “E”, thus resulting in a lower P/E ratio through such nonproductive means as raising corporate debt to fund share buybacks. Such are not the conditions of sustained multiple expansion into the future or the foundation of healthy economic growth for that matter.
- Moreover, they suggest that if one were to remove these artificial influences when determining current valuations that stock price valuations are actually quite a bit more expensive today than what the current numbers might indicate.
In short, valuations are as high as they have been in the case of many stocks today. In the best-case scenario, it will serve as a headwind for many stocks as they attempt to advance further in the coming quarters If we were to enter into a new bear market, it suggests that stocks have that much further to fall before it’s all said and done.
2. Leverage
Here we go again. At the heart of the financial crisis in 2007 were major banking institutions promoting complex financial instruments and engaging in reckless lending activity that eventually culminated in the near collapse of the global economy…[Now] many of these same major financial institutions, some of which are now even bigger than they were before, have returned to many of the very same misguided and aggressive lending techniques that preceded the last crisis…
One of the many illustrations of this return to aggressive lending and borrowing activity is the fact that NYSE margin debt, which is a measure of how much money has been borrowed to purchase stocks, is now [see chart below] as much as 15% to 25% higher today than the peak levels that preceded the start of the last major bear market in 2007….[and] the more margin debt and excess leverage that has to be unwound, the greater the market pain is likely to be in the end.
(click to enlarge)
3. Monetary Policy
The game appears to have changed for good at the U.S. Federal Reserve. After 27 years of pursuing a policy strategy that involved the perpetuation of a wealth effect through rising stock prices to support and stimulate economic growth, it appears that this effort may have finally run its course and that a new focus may soon take its place….
While the Fed’s QE during the financial crisis did manage to rescue the global economy from collapse in late 2008 and early 2009, the clear lesson in the five years since is that rising asset prices do not lead to sustainably robust economic growth. In fact, the uncertainty associated with artificially inflating asset prices may be doing far more harm than good by stunting growth.
This may mark the end of a market era if, indeed, the Fed is finally coming to this realization. If that is the case, not only are we almost certainly not likely to see any more QE once the Fed finally escapes from the current program it seems to want to so badly exit, but any future policy initiatives are likely to be far more targeted and purposely not designed to potentially inflate asset prices any further. [This, however,] would only serve to likely flame the income inequality issue that is already building as the stock market reaches new highs while the economy continues to stagnate.
[On the other hand, if] the above conclusions are wrong and the Fed actually wants to [continue] supporting further increases in asset prices going forward (after all, they certainly do not want to see the stock market suddenly collapse, which is one of the reasons that they are being so deliberate with the tapering process)…[then] exactly where are they going to draw upon the resources to accomplish this task? At the outbreak of the financial crisis during the 2007 to 2009 bear market, the Fed’s balance sheet stood at a relatively modest $870 billion, whereas today it has ballooned to $4.3 trillion and counting. The Fed has already created the potential for massive imbalances by allowing so much to accumulate in excess reserves within the banking system, so the idea of adding even more with a new program has the potential to push things over the edge.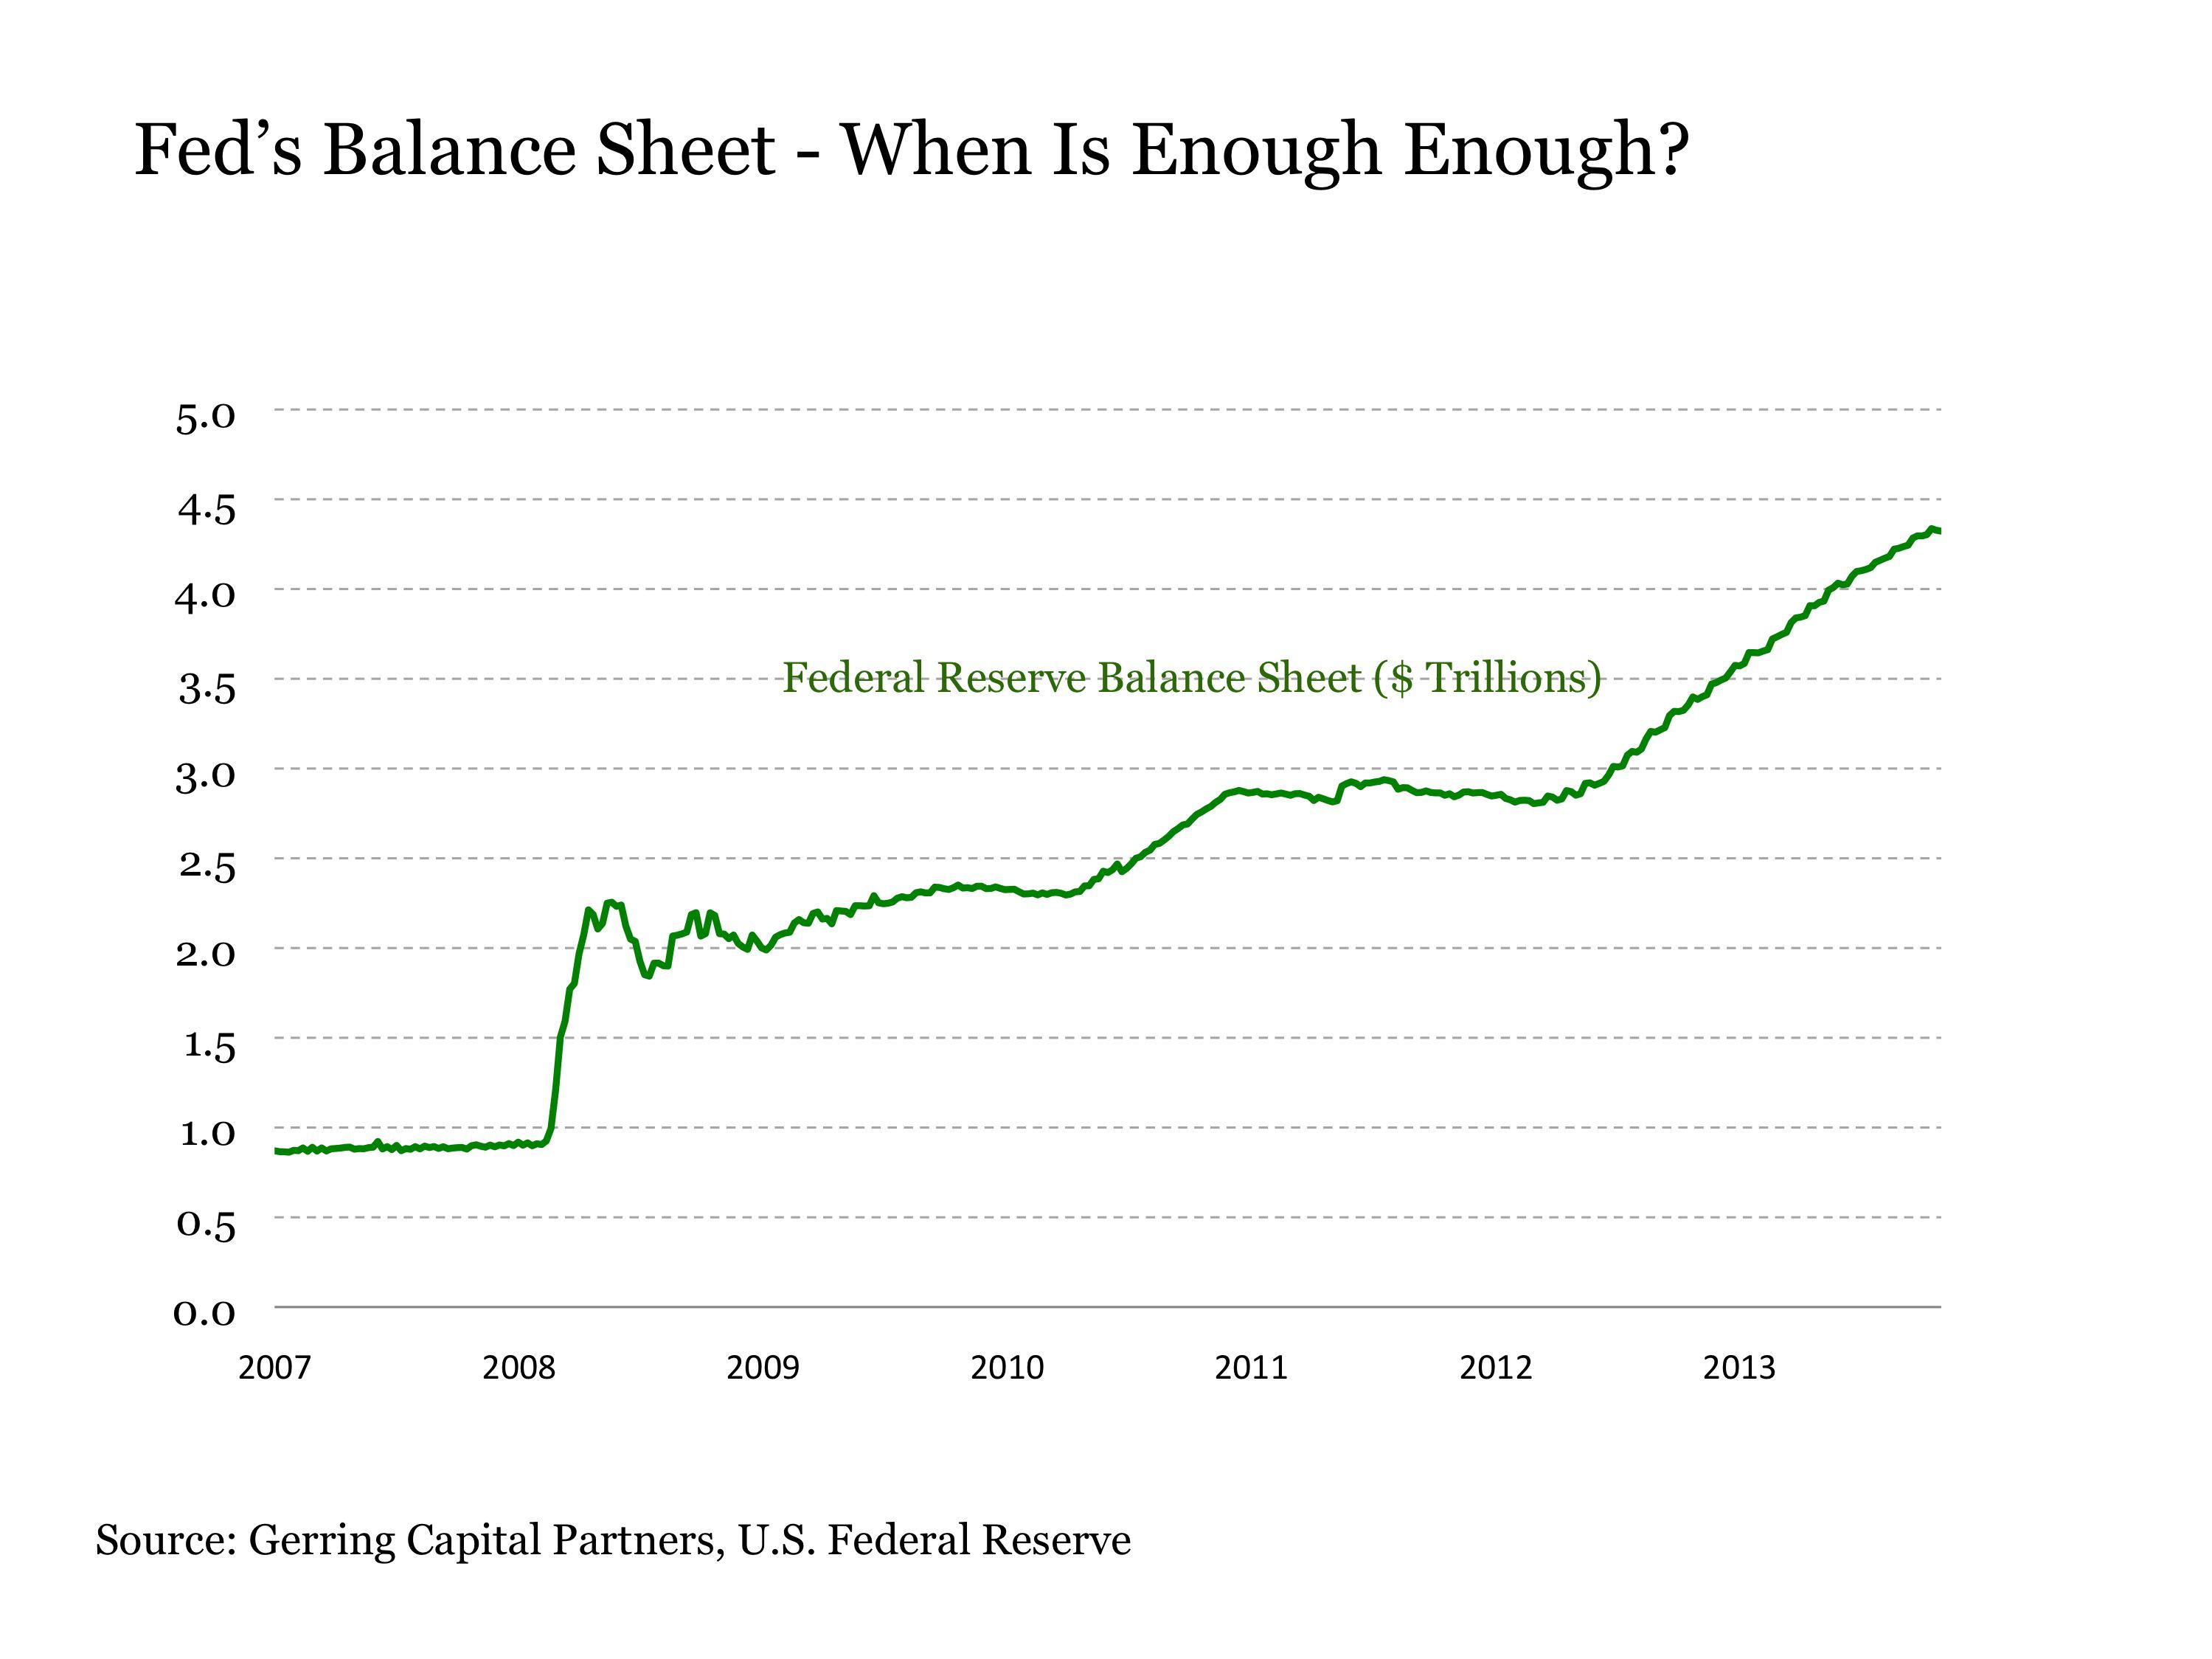
With all of this being said, maybe the Fed will be willing to go all in once again when the economy falters. After all, what’s a few trillion in money printing any more, right? Even so, the implementation of any future stimulus program does not mean that it will be targeted at increasing stock prices. After all, when dissecting market performance in response to Fed stimulus in the post crisis period, it is only when the Fed is engaged specifically in the daily purchase of U.S. Treasuries…[that] the stock market levitates. All other programs have had a neutral to incrementally positive influence on the stock market at best. Thus, we could see the Fed respond to the next crisis with a new major stimulus program, and the stock market continue to go down unabated.
…[T]his notion of Fed stimulus not supporting stock prices seems unbelievable…given the Fed has made it a religion to protect stock prices at all costs since the 1987 crash but one has to look no further than China to see how major stimulus programs can blow right by the stock market. There is little question that Chinese policy makers have been aggressive in their own right with monetary stimulus during the post crisis period but, not only has this done little to support Chinese stock prices, their market, as measured by the Shanghai Stock Exchange Composite, has been in a full fledged bear market having lost more than -40% of its value over the last five years.
(click to enlarge)
While China is certainly a different market than the United States, the above example does highlight the very real possibility of this outcome. Of course, Japan has also been engaged in stimulus programs that, in many cases, were even more aggressively designed to boost stock prices, and they remain mired in a long-term bear market that has lasted nearly a quarter century to date even despite the recent rally since late 2012. In short, [therefore,] further Fed stimulus in the future does not necessarily mean higher stock prices by any means, as the composition of the stimulus is extremely important if nothing else.
Even with all of these considerations in mind, one simple fact differentiates today’s market with that of the 2000 to 2002 and 2007 to 2009 episodes – during these previous two bear markets, the Fed was in a position to ease aggressively, and did so, while today, not only is the Fed no longer in a position to ease aggressively, they may actually be inclined to tightening monetary policy. This represents an important differentiation in the support for stock prices the next time around.
Bottom Line
The next bear market may be shaping up to be quite the storm once it finally arrives:
- valuations are running high from a historical perspective across many segments of the economy,
- many of the bad lending practices that could ultimately lead to a seizing in liquidity conditions and capital market shocks as a result are also manifesting themselves at the present time and
- all of this is culminating at a time when the Fed is not only no longer showing the inclination to ease any further but is instead exhibiting the increasing inclination to tighten policy which suggests that little may be there in the way of support once stock prices finally fall.
- Of course, the one thing the Fed is unlikely to want to see happen is a sudden, sharp fall in stock prices. As a result, they are likely to give markets just enough in any future bear market scenario, not necessarily with the intent to induce it to rise but, instead, just enough to keep it from completely unraveling to the downside.
All of these forces lead to two end points:
- The Fed has little to offer in the way of future policy support coupled with the notion that they will likely be inclined to provide just enough to keep markets limping along which suggests that
- the eventual bear market could last much longer than most any investor is anticipating as the natural bear market cleansing process is dragged out as a result…
Editor’s Note: The author’s views and conclusions in the above article are unaltered and no personal comments have been included to maintain the integrity of the original post. Furthermore, the views, conclusions and any recommendations offered in this article are not to be construed as an endorsement of such by the editor.
*http://seekingalpha.com/article/2253803-the-worst-bear-market-is-yet-to-come (© 2014 Seeking Alpha )
Related Articles:
1. Today’s Shiller PE Suggests the Stock Market Is Overvalued By 60%!
We estimate that a ‘fair price’ for the market is a Shiller PE of around 16. With the market at close to a Shiller PE of 26, the market is overvalued by about 60%. Now is not a historically good time to initiate a position in the S&P500. Read More »
2. EXPECT & PLAN For A Major Stock Market Correction In the Coming Weeks/Months – Here’s Why & How
The S&P 500 is now up over 180% since troughing in March 2009 and it has been almost 3 years since the stock market experienced a 10% correction. Historically, market corrections happen approximately every 2 years on average. [As such,] we think that this rally is getting very long in the tooth and we wouldn’t be surprised if we have a healthy pullback in the coming weeks or months. Read More »
3. Extreme Greed By the Crowd Suggests You Show Some Fear! Here’s Why
Greed may have been good for Gordon Gekko. but in the investment world it rarely is. As Warren Buffett is famous for saying “…be fearful when others are greedy and greedy when others are fearful” [and now is such a time]…to start showing some level of fear here in the face of extreme greed by the crowd. The crowd can be right for a long time, but they are rarely right at extremes. While this time may be different, the probabilities suggest that at the very least it will be a more difficult environment for equities going forward.
4. Make No Mistake – A Major Stock Sell-off Looms! Here Are 4 Ominous Signs
The 4 fundamentals and technicals discussed in this article accurately called stock market crashes in 2000 and 2007 and these same market metrics are again TODAY warning that a possible financial tsunami is brewing on the horizon. No one knows for certain WHEN the tsunami will hit Wall Street…but, without question, today’s stocks exhibit extremely exaggerated valuations, and extremes never last, so make no mistake, a major stock sell-off looms.
5. These Indicators Should Scare the Hell Out of Anyone With A Stock Portfolio
For US stocks — and by implication most other equity markets — the danger signals are piling up to the point where a case can be made that the end is, at last, near. Take a look at these examples of indicators that should scare the hell out of anyone with a big stock portfolio.
6. Remember the “Nifty 50″? It’s Back! What Does It Means For the Markets Going Forward?
Market historians will recall the term “Nifty 50” originated in the 1960’s bull market to describe 50 wildly popular large-cap stocks at the time. Interestingly, some of the same names from that list are leading the market higher today. The question for investors, of course, is what this selective advance means for the markets going forward.
7. This Is One “Crazy, Nastyass” Stock Market! Here’s Why
You can call this current stock market a blowoff or call it a Wile E. Coyote moment or call it a divergence or call it a disconnect or call it a lapse of judgement. You can call it whatever you want but I call it the “Honey Badger” market because this is one “crazy, nastyass” stock market – and I can’t believe I’m watching it happen all over again. Read More »
8. Are You A Bull Or A Bear? Here Are Indicators & Charts That Support Your Thesis
The current U.S. equity market has something for everyone. Whether you are bullish or bearish, there is no shortage of indicators or charts you can use to support your thesis. Let’s run through both the Bull and the Bear case here. In the spirit of Confirmation Bias, feel free to skip ahead to the part that best supports your current positioning. Read More »
9. Are We In Phase 3 – the Final Phase – of This Bull Market Yet?
Are we in the third phase of a bull market? Most who will read this article will immediately say “no” but isn’t that what was always believed during the “mania” phase of every previous bull market cycle? With the current bull market now stretching into its sixth year; it seems appropriate to review the three very distinct phases of historical bull market cycles. Read More »
10. Is Now the Calm Before the Storm?
I’d argue that the record low volume shows investors aren’t looking ahead as much as looking behind and reminiscing at how good things have been over the past five years or so. They’re expecting more of the same even though it’s mathematically impossible people. Read More »
11. Should You Care What’s Happening On the Nikkei 225? YES! Here’s Why
Should markets around the world really care about what the Nikkei 225 Index does? The Power of the Pattern suggests “yes”! Here’s why. Read More »
12. Collapse of S&P 500 May Be Only Weeks Ahead! Here’s Why
When Staple sector (i.e. defensive) stocks started to reflect greater relative strength than Discretionary sector stocks back in 2000 and again in 2007, the S&P 500 began to fall dramatically in the ensuing months. That’s happening again. Can a collapse of the S&P 500 be far behind? Read More »
13. There’s Evidence – Plenty of It – That the Bear Is No Longer Hibernating. Here’s Why
The health of a market is best assessed along three vectors: fundamentals, technicals (price action) and sentiment and this is what each is saying about the health of the markets these days. Read More »
14. A 20%+ Sell-off is Brewing In the Lofty U.S. Stock Markets – Here’s Why & What the Future Holds
For today’s seriously overextended and overvalued US stock markets the best-case scenario is a full-blown correction approaching 20% emerging soon while the worst case is a new cyclical bear market that ultimately leads to catastrophic 50% losses. Read More »
15. Margin Debt: It Doesn’t Matter ’til It Matters! Is Now the Time to Be Worried About the S&P 500?
It doesn’t matter until it matters! IF margin debt should start decreasing swiftly, history would suggest something different is taking place in the mind of aggressive investors. Will a decline in margin debt from all-time highs matter this time? Read More »
16. 2 Stock Market Indicators Are Saying “Be careful, don’t get caught up in the euphoria”
In the midst of all the optimism we see towards key stock indices these days, there are two leading indicators that are flashing warning signals. They say, “Be careful, and don’t get caught up in the euphoria.” Read More »
17. Beginnings of Massive Stock Market Correction Developing: Don’t Delay, Prepare Today!
No stock can resist gravity forever. What goes up must eventually come down. This is especially true for stock prices that become grotesquely distorted. We have been – and still are – living in another dotcom bubble, and – like the last one – it is inevitable that it is going to burst. Read More »
18. 3 Historically Proven Market Indicators Warn of an Impending Market Top
It’s frustrating to see key stock indices keep pushing higher when historically proven market indicators are all warning of a crash ahead. Irrationality is exuberant to say the very least, and that’s why I believe this rally is counting its last days. Read More »
19. The Stock Market Is a Risky Place to Be – Here’s Why
With both the fundamentals and the technicals saying the stock market is a risky place to be, we await its crash back to reality. Here’s why. Read More »


The US used to worry about the Soviet BEAR threat, now the US BEAR market is our greatest threat.
Is anyone else concerned about our Government’s management of our economy, if so, I’d like to read your thoughts.
Čudovite urice Mini watch v naši online trgovini Time In Trend. Poglej si modno kolekcijo danes.