What would you say if I told you that the S&P 500 is going to 7,000, the Dow Jones  Industrial Average is going to 56,000, and the Nasdaq is going to 29,000 in the next 6 to 7 years. If you’re waiting for the punch line, convinced that it’s a joke well, it’s no joke. Here’s why.
The above introductory comments are edited excerpts from an article* by Joseph Cafariello as posted on SeekingAlpha.com under the title S&P 7,000? Dow 56,000? Nasdaq 29,000?.
Cafariello goes on to say in further edited excerpts:
U.S. equity markets are currently at the beginning of a monster bull run, the likes of which we have not seen since the 1990s.
- Today’s manufacturing conditions are similar to what they were in the early 1990s and
- we’re at the same place within the interest rate cycle as we were just prior to the commencement of the monster bull run back then
From late 1993 through early2000,
- the Dow Jones ran from 3,700 to 11,700 for a gain of 216%…
- the S&P ran from 450 to 1,525 for a gain of 239%, and
- the Nasdaq surged from 800 to 5,000 for a gain of 525%
and it’s about to happen again!
Sow seeds under similar conditions, and you generally get similar harvests, and indications are we are currently in a similar place as we were in December 1993, the two most prominent ones being:
- We are in a similar place within the economic cycle, in transition from major recession to major expansion; and
- We are in a similar place within the interest rate cycle, in the stable flatlands after reductions and before increases.
Condition 1: Extreme Manufacturing Expansion
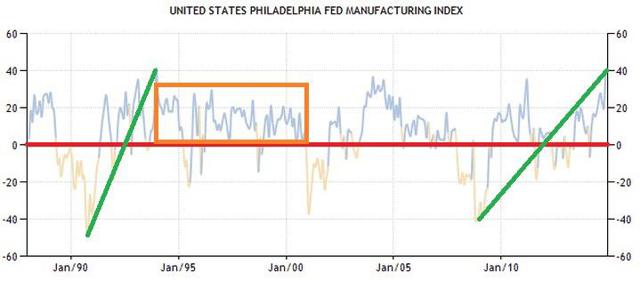
Firstly, the latest Philadelphia Fed Manufacturing Index (the Philly Fed report) for November came in at 40.8, rising above 40.0 for the first time since… guess when… December 1993. A reading above zero indicates manufacturing expansion, while a reading below zero indicates contraction.
Both then and now, U.S. manufacturing mounted a steady climb from a -40 Philly Fed reading (extreme contraction) to a +40 reading (extreme expansion), noted in green in the graph below.
Where it took some 3 years for the Philly Fed index to rev up from -40 to +40 in the early 1990s, it has taken some 5 years for manufacturing to mount the same impressive turnaround this time, from late 2009 to November 2014.
These extreme +40 Philly Fed readings are not peaks for manufacturing, as it might seem simply by looking at the graph. Growth/contraction graphs do not measure the “level” of manufacturing but the “change” in that level. In other words, it doesn’t measure speed but acceleration.
What followed the extreme +40 Philly Fed reading of December 1993 was an extreme growth cycle which stretched out 7 years until 2000 (orange box). All those readings of manufacturing expansion within that orange box are to be added to that December 1993 reading to derive the true manufacturing level. Think of it as manufacturing + 40 + 20 + 35 + 25, etc. Though 40 is the largest reading in the series, actual manufacturing output grows by the sum of all the changes, growing larger with each positive reading.
Source: TradingEconomics.com
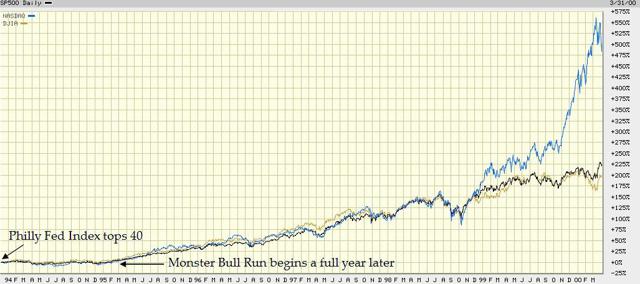
Of course, while manufacturing had picked up by December of 1993, it took the equity markets a little longer to respond in kind, as noted in the graph below.
In fact, the markets waited a full year after the Philly Fed’s extreme reading before climbing. It was like a jumbo jet revving up its engines at the end of the runway; there was a bit of a lag before the markets actually took off.
Source: BigCharts.com
Hence, December 1993’s +40 Philly Fed reading was not a peak for American manufacturing, but was merely the beginning of a long growth spurt that was mirrored in equities by the Great Bull Run of the 1990s, and the same holds true today. This month’s reading is by no means a peak. As great as the run in equities has been until now, the economy is still just revving up its engines. The markets have yet to take off.
Of course, that monster bull run was ultimately driven off a cliff in the monster crash of 2000, followed by the monster bear that loitered until 2003, but there’s no need to concern ourselves with the end of the bull that is to come, as we still have another 6 to 7 years before that happens. So dip your cup and have your fill of stock-nog before the punch bowl is taken away.
But wait a second. Isn’t the U.S. Federal Reserve about to take that punch bowl away very soon? Perhaps as early as 2015, when it starts raising interest rates? Don’t rising rates kill bulls dead? Yes and no.
Condition 2: Sweet Spot in Interest Rates
Yes, rising rates do kill an equity bull run but only when the bull has been running hard for a long time and is exhausted. Our bull is only just getting started, and the first wave of rising rates isn’t going to stop it, just as rising rates didn’t stop the bull of the early 1990s.
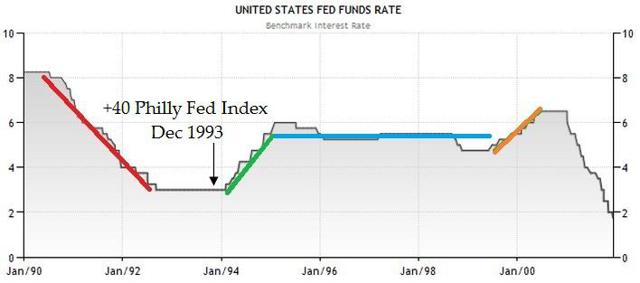
As noted in the graph below of the U.S. Federal Reserve’s benchmark Fed Funds Interest Rate, we find ourselves today in precisely the same place within the interest rate cycle as the last time the Philly Fed index hit +40 in December 1993.
Source: TradingEconomics.com
Interest rates were slashed drastically from 1990-92 (red) and then rates were held flat until the economy mended, with the Philly Fed index rising from -40 to +40 by December 1993, shortly after which the Fed started raising rates (green). That is precisely where we are today within the interest rate cycle, after a series of rate reductions from 2008-09, at the end of a long flat period of no rate changes, and just before the Fed begins raising rates back up. The current +40 Philly Fed reading came in right on cue.
Just as the first wave of rising rates from 1994-95 did not kill the bull run of the 1990s, neither will this upcoming first round of rate hikes stop today’s bull.
- Following its first round of rate hikes from ’94-’95, the Fed paused, holding rates relatively flat for some 4 years from 1995-99 (blue). By that time, the equity market was simply on fire, with the S&P 500 climbing nearly 1,000 points from 450 in late-1993 to 1,400 by 1999, alarming many. Even as early as December of 1996, then Federal Reserve Chairman Greenspan warned investors of the “irrational exuberance” that was running wild.
- By 1999, the Fed began to take precautions, launching a second wave of interest rate hikes (orange) in an effort to cool the markets and take away the punch bowl that had intoxicated them.
- It was then that the bull finally died. Not by the first wave of interest rate hikes from 1994-95, but by the second wave of rate hikes from 1999-2000, some 5 years later.
As then, so now. After a long period with interest rates at ultra-low levels, economists expect the Fed to begin raising rates soon, but just a little at first, perhaps up to the 3% area by 2017 or so. Once there, the Fed will likely pause for another period of relatively flat rates (corresponding to blue above), during which time the U.S. equity markets will run like they haven’t in 20 years.
During this upcoming flat period in interest rates, which could last from 2017 until 2020 or so, we can expect equity markets to mount another run of similar magnitude as the first, rising perhaps as much as 200% or more, taking the indices to their above-noted projections.
The cycle is not yet complete, however.
- Once investor sentiment reaches the same level of euphoria as the previous iteration,
- once people start quitting their jobs to take up day trading,
- once they start handing out stocks as birthday gifts,
- once you start getting stock tips from your waiter and hair stylist,
- then the time will have come for the Federal Reserve to launch its second wave of rate hikes designed to cool overheating markets and take the punch bowl away from its inebriated patrons.
At that time, the monster bull will then be run off another precipitous cliff – but now is not the time to worry about that.
Get Your Fill Now
This monster bull is still accelerating, and hasn’t even broken a sweat yet. There is plenty of run left in equities.
Don’t fear the coming interest rate hikes. Sure, the first one will cause the markets to stumble a little. The first of anything is always a bit of a shocker but, just as the first wave of interest rate hikes did not kill the last monster bull, this upcoming first wave will not kill this bull either.
As the recent Philly Fed index showed, the U.S. economy has revved up its engines to levels unseen in two decades. There it sits at the edge of the runway, ready, willing and able to lift us into the clouds. Are you strapped in for the ride?
Editor’s Note: The author’s views and conclusions in the above article are unaltered and no personal comments have been included to maintain the integrity of the original post. Furthermore, the views, conclusions and any recommendations offered in this article are not to be construed as an endorsement of such by the editor.
*http://seekingalpha.com/article/2711825-s-and-p-7000-dow-56000-nasdaq-29000?ifp=0 (© 2014 Seeking Alpha)
If you liked this article then “Follow the munKNEE” & get each new post via
- Our Newsletter (sample here)
- Twitter (#munknee)
Related Articles:
The pullback I’ve been warning you about in the U.S. equity markets is finally at hand but, once this pullback in the broad stock indices is over, the Dow Jones Industrial will lead the way higher yet again, and catapult to 31,000 over the next three years, with gold reaching $5,000, silver $125 and select individual stocks in the mining sector spinning off gains of 2,000%, 3,000% and even more. No, I’m not out of my mind. Quite to the contrary, I believe I am the one analyst who really understands the forces that are building to enable such to occur. Read on to learn about my enviable track record over the years and specifically why such gains will be realized over the next three years. Read More »
2. Stock Market (Dow) Should Reach 20,000 By 2018 – Here’s Why
With the stock market up over 20% since we forecast in July, 2012 that we would see the Dow at 20,000…[by the end of the] decade, our forecast seems less ambitious than back then. US stocks are not overpriced or overleveraged, and remain more attractive than at prior peaks. As such, based on current conditions, we now project that…the Dow will reach 20,000 by late 2018. Read More »
3. Gold Will Go To $5,000 and the Dow To Above 27,000 by 2015
Warning! The forecasts you’re about to read are controversial, and many will say I have lost my mind. No problem. Many have said the same about me numerous times in the past but the forecasts I speak of today are based entirely upon my proprietary trading models that… have successfully guided me and the investors that have followed me through every twist and turn in the economy and markets… since I developed them in 1982. Words: 895 Read More »
 munKNEE.com Your Key to Making Money


